20.109(S24):M2D5
Contents
Introduction
Now that you have successfully incorporated your sequence of interest into the YSD plasmid, it's good to ensure that your peptide of interest is displayed at the cell surface. While the CTCON2 plasmid has already been used previously for yeast cell surface display, it's good practice to ensure this is also the case for your experimental model.
Because our YSD peptide is controlled by galactose induction, we will also use this experiment to test our induction efficacy. You will have two experimental samples: one expressing your plasmid without induction, and another expressing the plasmid with galactose induction. Only the latter should show peptide expression at the cell surface.
There are a few different ways to determine peptide expression, but most techniques rely on the use of antibodies to visualize the expressed protein. Since we are interested in the expression of small peptides which will have a wide variety of sequences, our experiments will not attempt to use antibodies raised against the peptide itself, but against an incorporated tag. If you refer back to previous information, you will see that the CTCON2 plasmid incorporates a Myc tag at the N-terminus of your peptide of interest and an HA tag at the C-terminus. We will be using antibodies raised against the Myc tag.
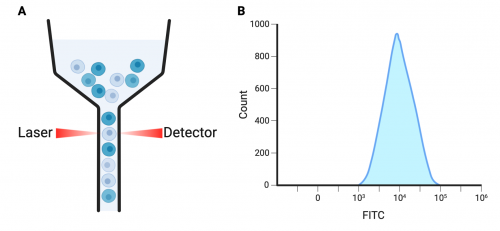
To visualize antibody labeling (or lack thereof) we will use flow cytometry. This technique uses narrow tubing to aspirate cells and passes each cell in single file past light sources, including a laser to excite the fluorophore conjugated to our secondary antibody. As the cells are pass by the different light sources, they also pass by a detector which will record information about the inherent cell properties (such as size and shape) as well as the level of fluorescent labeling. We will use this information to make assessments about the induction and expression of your cell surface peptides in this model.
Protocols
Part 1: Induce expression of YSD peptide
For timing reasons, the induction steps were completed prior to class. So you understand how the cell suspensions you will use for the metal nucleation assays were created, please review the steps below.
- Inoculated 5 mL of CMS-T media with a colony of ΔMet17 cells transformed with the pCTCON2 containing your peptide of interest.
- Incubated the culture overnight at 30 °C with shaking at 220 rpm.
- Dilute the overnight culture 1:10 in 10 mL of fresh CSM-T media.
- Incubate at 30 °C for 4 hours with shaking at 220 rpm.
- To induce cell surface peptide expression, pellet cells through centrifugation at 1000 x g for 5 minutes, and resuspend pellet in 10ml of CSM-G media.
- Incubate overnight at at 30 °C with shaking at 220 rpm.
Part 2: Stain transformed yeast to determine YSD expression
Prior to this session, the instructors induced your transformed yeast cultures so that they would express your chosen peptide at the cell surface. We will now use flow cytometry to confirm that your peptide is expressed at the cell surface.
Retrieve yeast culture labelled with your groups color from 30°C incubator
- Measure the optical density (OD) of your yeast on the spectrophotometer.
- You will have two samples: uninduced ΔMet17 yeast with your plasmid (grown in CSM-T), and ΔMet17 yeast induced to express your peptide (grown in CSM-G).
- Blank the spectrophotometer with 1000 uL of CSM in a clear cuvette
- Add 900 uL of CSM to a new cuvette. Add 100 uL of your yeast culture and mix well by pipetting up and down.
- Record the OD600 of your sample by taking a measurement using the spectrophotometer and multiplying by 10 (to account for the 10x dilution).
- Determine how many microliters of your sample are required to analyze 1x10⁶ yeast cells.
- The conversion rate from OD to cells for yeast is: (107 yeast cells)/(OD x mL of culture)
- Thus, An optical density of 1 at 600nm equals 107 yeast cells per mL.
- Add the correct volume of culture (calculated above) such that 1x10⁶ yeast are added to a microcentrifuge tube for each sample.
- Add an additional 900 uL of PBSA to each centrifuge tube and pellet the cells for 2 minutes in microcentrifuge at 4000xg.
- Discard supernatant carefully with a pipette (Do not touch or disturb the yeast pellet!). Wash with an additional 1 mL of PBSA, pellet, and remove supernatant. Repeat washing step once more.
- Resuspend pellet in 1ml PBSA
- Add antibody to samples: Add 1 uL of the antibody specific for the myc tag to both tubes.
- Incubate samples on nutator at room temperature for 1 hour.
- During this incubation time, complete Part 3 of the protocol.
- After incubation, pellet cells at 4000xg for 2 minutes. Discard supernatant carefully with vacuum aspirator or with pipette (Do not touch or disturb the yeast pellet!).
- Wash with an additional 1 mL of PBSA, pellet, remove supernatant, and resuspend with 1 mL of PBSA.
- Add 1uL goat anti-mouse 488 secondary antibody to both tubes.
- Incubate samples on a nutator at room temperature for 30 minutes.
- Wash with an additional 1 mL of PBSA, pellet, remove supernatant, and resuspend with 1 mL of PBSA.
- Place samples on ice until analysis.
In your laboratory notebook, complete the following:
- Calculate the volumes of yeast required to measure 1x10⁶ cells
Part 3: Perform metal nucleation experiment
For timing reasons, the induction steps were completed prior to class. So you understand how the yeast cultures were incubated with cadmium, please read the following section before completing the experiment.
- The instructors induced expression of YSD peptides of the following cultures as described above:
- Cultures of ΔMet17 transformed with YSD-peptide expressing culture from each team
- Untransformed ΔMet17 (these cells were incubated in CSM + tryptophan since they do not have a plasmid)
- ΔMet17 transformed with control peptide GGGGGG
- ΔMet17 transformed with control peptide GCCGCC
- Yeast OD600 was measured for each culture using a spectrophotometer
- Using CSM-G media as a diluent, each culture was diluted to OD600 ~ 1.0 and a final volume of 8ml.
- Cd(NO3)2 was added for final concentration of 100μM in each culture.
- Glass culture tubes were incubated shaking at 30°C overnight to allow sufficient nucleation to the cell surface display peptides.
You will now complete the following steps to process your cultures so that they can be analyzed to determine how effective your peptides are in removing cadmium from the media environment.
- Transfer your culture to a metal-free 15ml conical tube which can be obtained at the front bench.
- Centrifuge cultures at 1000 xg for 5 minutes to pellet cells.
- During centrifugation, label 2 metal-free 15ml conical tubes for your culture, and prepare a 10ml syringe filter.
- Using a serological pipette, remove 6ml media supernatent without disrupting the pellet and add it to a metal-free conical tube.
- Open your 10ml filter syringe and place it over the top of a fresh metal-free conical tube. Add the media sample to the open syringe and use the plunger to push the sample through the 0.22 μM filter.
- Bring your samples to the front bench and add 175ul ultra-pure nitric acid to the filtered sample.
- Using a serological pipette, carefully triturate the sample to fully mix the acid.
- Close each tube with sample and place them at the front bench.
- Discard materials used to filter the samples in the black bin at the front bench.
In your laboratory notebook, complete the following:
- What volume of Cd(NO3)2 that was added to obtain a final concentration of 100 μM?
- Why is it important to use metal-free tubes to store your samples for analysis?
- Why is it important to filter your samples before submitting them for analysis?
Part 4: Accuri Flow Cytometry of Stained Yeast Samples
To prepare for analysis, the Accuri flow cytometer needs to be flushed with fluid to remove any contamination from previous samples. Your samples will then be filtered one by one into round bottom analyzer tubes and placed under the cytometer sample injection port (SIP). The machine will then suck up the sample, and pass the cells by a laser to register cells labeled with antibodies conjugated to a 488 fluorophore. The Accuri will record the data and report the number of cells with different levels of fluorescent labeling in a histogram.
- Turn machine on. MilliQ water (ultra-pure water) should be in a tube on the sample injection port (SIP).
- Visually check waste containers and buffers.
- Open BD AccuriC6 software on the computer.
- To clean the machine, place a round bottom tube with cleaning solution on the SIP and under Run settings, choose "Run with Limits" and set 5 minutes and click RUN.
- Once the 5min cleaning is complete, place an empty tube on the SIP and under Run settings, click the backflush button to rinse the system.
- Place a fresh tube with 2ml of MilliQ water and run for 2min.
- You are now ready to analyze your samples.
- Place one filter cap tube in a rack and take your unstained yeast sample from the ice bucket.
- Invert the yeast microcentrifuge tube once, take the P1000 pipet and take up the yeast sample. Place the pipet tip flush against the filter cap and push the yeast sample through the 35um mesh into the round bottom tube.
- Remove the filter cap off of the yeast sample, take the MilliQ water tube off of the SIP and place the tube with filtered yeast on the SIP.
- Choose the analysis parameters in the software under Run settings. Run with limits: 3 minutes
- Choose an analysis cell in the software with no events recorded and hit the RUN button.
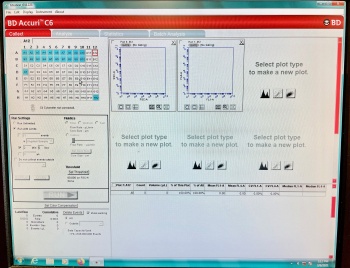
- Unused cells are white (Example, C1) and cells with stored data are blue (Example, A1).
- As the analysis proceeds, prepare your next yeast sample according to the steps above.
- Data is collected in individual cells in the software. Make sure to move the event record to a new cell before analyzing your peptide-expressing yeast.
- Write in your notes which samples are analyzed in each flow cell.
- Once the samples are analyzed, place a round bottom tube of Decon solution (10% bleach) on the SIP and run for 2min.
- The flow cytometer is now ready for the next user.
In your laboratory notebook, complete the following:
- What does the presence of 488 signal indicate in your experiment?
Reagents list
- Complete synthetic media - tryptophan (CSM-T) media: 0.17% yeast nitrogen base without amino acid and ammonium sulfate (BD Bacto), 0.5% ammonium sulfate (Sigma), 0.13 % amino acid mix lacking tryptophan (US Biological), 2% glucose (BD Bacto), 0.1% adenine hemisulfate (Sigma)
- Complete synthetic media - tryptophan + Cysteine, Methionine, and galactose (CSM-G) media: 0.17% yeast nitrogen base without amino acid and ammonium sulfate (BD Bacto), 0.5% ammonium sulfate (Sigma), 0.13 % amino acid mix lacking tryptophan (US Biologicals), 0.005% Methionine (Sigma), 0.005% Cysteine (Sigma), 2% galactose (Sigma), 0.1% adenine hemisulfate (Sigma)
- Cadmium nitrate (Sigma), stock concentration= 100mM
- ULTREX II, Ultrapure Nitric acid (J.T. Baker)
- Hydrophilic PTFE 0.22μm filters (J.T. Baker)
- Metal-Free sterile polypropylene tubes (VWR)
- Mouse anti-myc antibody (1:1000, Sigma)
- Alexafluor-488 Goat anti-mouse antibody (1:1000, Life Technologies)
- PBS-A: PBS with 1% BSA
Next day: Quantify cadmium removal from media


