20.109(F19):Prepare for cellular thermal shift assay (Day1)
Contents
Introduction
This module is a continuation of work started by previous 109ers! Upon identifying putative ligand binders using an SMM screen, secondary assays were completed. In these secondary assays purified FKBP12 was used for in vitro testing. First, an experiment was performed to ensure that the purified FKBP12 was active. Second, the active protein was used in a binding assay with the putative ligands. Information on the previously completed assays is below. You will use this information to review the data collected in previous semesters, then you will select a ligand to further test using an in vivo assay.
Peptidyl-prolyl isomerase (PPIase) assay
FKBP12 activity was assessed PPIase assay. PPIases catalyze cis-trans isomerization reactions that are essential to efficient protein folding in vivo. Specifically, these enzymes isomerize peptide bonds that are N-terminal to proline residues in polypeptide chains. Without PPIases, isomerization would be the rate-limiting step in protein folding.
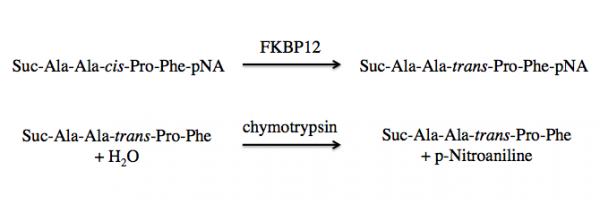
FKBP12 is a class of PPIases and the activity can be measured by quantifying the isomerization and subsequent cleavage of a substrate, suc-AAFP-pNA (also written as Suc-Ala-Ala-Pro-Phe-NA). In this method, FKBP12 catalyzes the isomeration of the cis-Ala-Pro bond to a trans-Ala-Pro bond. Then a second enzyme, chymytrypsin, cleaves the trans form of the peptide. See the reaction schematic below.
When at equilibrium in solution, approximately 88% of the commercially available suc-AAFP-pNA substrate is in the trans from, leaving only a small amount of the peptide for isomerization. Because of this, the suc-AAFP-pNA substrate is prepared in trifluoroethanol (TFE) containing lithium chloride, LiCl. The Li+ ions maintain the substrate in 60% cis form.
Upon cleavage by chymotrypsin, the release of p-nitroaniline results in a yellow color in alkaline conditions, which absorbance can be measured at 405 nm. The rate of ΔA405 nm (change in absorbance at 405 nm) in the presence versus absence of FKBP12 is used to calculate the activity.
Differential scanning fluorimetry (DSF)
Interactions between low molecular weight ligands and proteins have been shown to increase the thermostability of proteins. This means that proteins bound to ligand are able to maintain tertiary structure, or resist denaturation, at higher temperatures than unbound proteins. DSF was used to examine the potential FKBP12 binders identified in the SMM screen.
DSF is a method used to identify low molecular weight ligands that bind and stabilize a protein of interest. In this assay, protein denaturation is measured via a fluorescent dye that has an affinity for hydrophobic regions. When the protein is folded the hydrophobic pockets are inaccessible to the dye and the fluorescent signal is quenched by water in the solution. As the protein unfolds, the dye interacts with the hydrophobic regions and emits a fluorescent signal that can be detected.
When a protein is bound to a ligand, the stability can be increased such that the temperature at which the protein denatures is increased. In the DSF assay, this is measured as a shift in the Tm, or melting temperature; which is defined as the temperature at which 50% of the protein is unfolded. This value represents the midpoint of the transition from structured (folded) to denatured (unfolded).
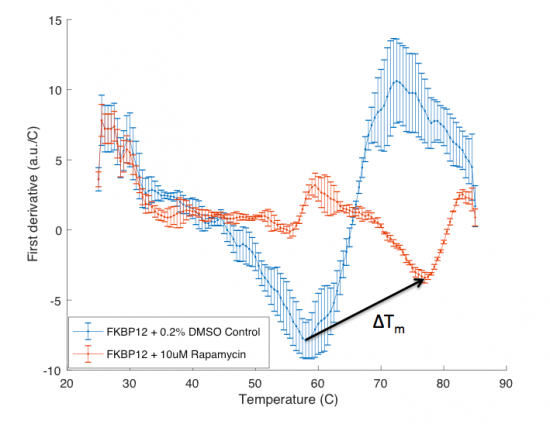
The ΔTm is the difference between the Tm of the unbound protein sample, or protein sample without added ligand, and the bound protein sample, protein sample with added ligand. If the tested ligand binds the protein of interest, the ΔTm can be observed as a shift in the plotted DSF data. For example, the data below show results of a pilot experiment completed in preparation for this module. In this graph the Tm of FKBP12 (blue curve) is ~50 °C. With the addition of rapamycin (red curve) the Tm is shifted to ~78 °C resulting in a ΔTm of ~20 degrees. Data in this plot was obtained by Becky Leifer from the Koehler laboratory.
Protocols
Part 1: Communication Lab workshop
Our communication instructors, Dr. Sean Clarke and Dr. Prerna Bhargava, will join us today to provide some tips for your research proposal presentation.
Part 2: Expand cells for CETSA
You will use the mammalian culture techniques you learned in Mod 1 to prepare Mouse embryonic fibroblast (MEF) cells for the CETSA experiment. Because the CETSA experiment will require a large number of cells to complete, today you will transfer cells from a T25 to a T75 to expand the cell culture (promote growth). The flasks you prepare today will be used the Instructors to seed the flasks for your experiment.
Preparing the tissue culture hood As a reminder, the tissue culture hood is partly set up for you. Finish preparing your hood according to the demonstration, first bringing in any remaining supplies you will need, then obtaining the pre-warmed reagents from the water bath, and finally retrieving your cells from the 37 °C incubator.
- Spray everything (except cells) with 70% ethanol!
- Be mindful of moving materials in and out of the hood because this disturbs the air flow that maintains a sterile environment inside the hood. Think about what you will need during your experiment to avoid moving your arms in and out of the hood while you are handling your cells.
Collecting cells
- Obtain 1 ~24 h culture of MEF cells in a T25 flask from the 37 °C incubator.
- Examine your cell culture after you remove the flask from the incubator.
- Look first at the color and clarity of the media. Fresh media is reddish-orange in color and if the media in your flask is yellow or cloudy, it could mean that the cells are overgrown, contaminated, or starved for CO2.
- Next, look at the cells using the inverted microscope. Note their shape, arrangement, and how densely the cells cover the surface of the flask.
- After you look at your cells, take the flask to your tissue culture hood to begin the seeding procedure.
- Aspirate the media from the cells using a sterile Pasteur pipet.
- Wash the cells by adding 3 mL PBS using a 5 mL pipet. Slightly tip the flask back and forth to rinse the cells then aspirate the PBS with a Pasteur pipet.
- With a 2 mL pipet, add 1 mL of trypsin to the flask.
- Tip the flask in each direction to distribute the trypsin evenly then incubate the cells at 37°C for 2 minutes using a timer.
- This is a great time to clear out your trash and read ahead!
- Retrieve your flask from the incubator and firmly tap the bottom to dislodge the cells.
- Check your cells using the microscope to ensure they are dislodged. They should appear round and move freely.
- If your cells are not detached from the flask, incubate at 37 °C for an additional minute.
- When your cells are dislodged, move your flask back into the tissue culture hood and add 3 mL of media to the cells then pipet the liquid up and down (“triturate”) to break up cells that are clumped together and suspend them in the liquid.
- Note: do not take up or release all the liquid, in order to avoid bubbles.
- Transfer the suspended cells into a labeled 15 mL conical tube.
- Transfer 90 μL of your cell suspension from the 15 mL conical tube into a labeled eppendorf tube.
- This aliquot will be used to determine the concentration of the cell culture.
- Be sure to cap your conical tube and eppendorf tube after you transfer your cells.
Counting cells
- Carry the tube with your 90 μL cell suspension aliquot to the center microscope bench and add 10 μL of trypan blue cell stain. Mix by pipetting up and down.
- Carefully pipet 10 μL of the stained cells between the hemocytometer and (weighted) glass cover slip.
- Count the cells that fall within the four corner squares (with a 4x4 etched grid pattern), average (i.e. divide by 4), and then multiply by 10,000 to determine the number of cells/mL.
- What is the density of the cell culture?
- Calculate the number of cells in the total volume of your suspension (3 mL).
Seeding cells
- Obtain one fresh T75 flask and label with the cell line and number of cells to be seeded (the number of cells calculated above).
- Include your team color, section information, and the date.
- Add the entire volume of cell culture harvested in the previous steps.
- You should mix your cell suspension by pipetting before distributing. The cells likely settled to the bottom of the conical tube while you were working.
- Add the volume of media needed to have a total of 12 mL in each T75 flask.
- For a total of 12 mL, subtract the volume of cell suspension added from 12 mL.
- Finally, tilt your flasks back and forth to distribute the cells evenly in the T75.
- Before moving your flasks to the 37 °C incubator, use the microscope to visually confirm that cells are present in the T75.
- Be sure to place your flask on the appropriate shelf.
Cleaning the tissue culture hood
The next group who uses your hood should find the surfaces wiped down and free of equipment.
- Aspirate any remaining cell suspensions.
- Dispose of all vessels that held cells in the biohazard waste box and be sure that all sharps are in the sharps jar.
- Remove any equipment or supplies that you transferred into the hood and return to the appropriate location.
- Please leave the equipment that was already there.
- Spray the TC hood surface with 70% ethanol and wipe with paper towels.
- Be sure the paper towels are disposed of in the biohazard waste box!
- Empty the benchtop biohazard bucket into the biohazard waste box.
Part 3: Select ligand to test
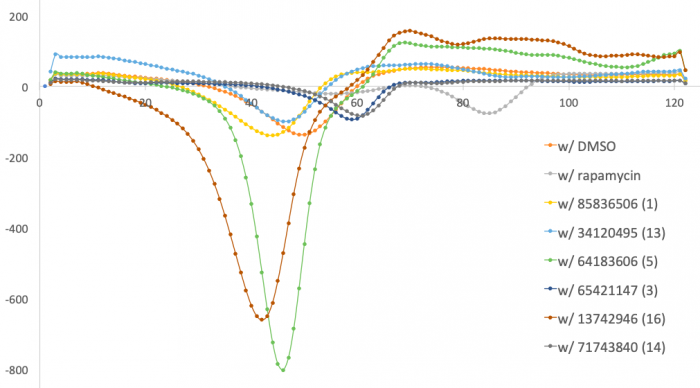
In previous semesters, 16 ligands identified using SMM were tested using the DSF assay described above. In this assay, a shift in the melting temperature (Tm), compared to FKBP12 w/ DMSO, suggests binding due to a change in protein stability. In this, what might a decrease in Tm suggest? An increase in Tm?
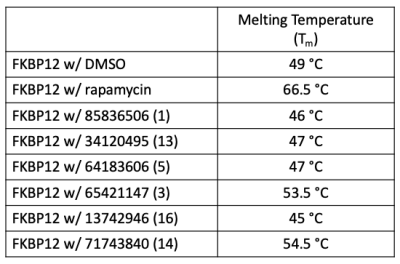
You will select one of the six ligands that were identified as putative binders using the DSF assay (results shown below). In this graph each line represents a condition in which FKBP12 was combined with DMSO or with a ligand then subjected to a temperature gradient. The lowest peak for each condition occurs at the temperature that the protein was completely destabilized, or the Tm. FKBP12 w/ DMSO is used as the negative control as no ligand is present, rather DMSO is included as it is the diluent used to prepare the ligands. FKBP12 w/ rapamycin is used as the positive control as it is well established in the literature that this compound binds FKBP12 with high affinity. From this experiment, 4 ligands that decrease and 2 ligands that increase the Tm of FKBP12 were identified.
To get a better understanding of how these data were generated, open the excel file containing the raw data (linked here). First, let's get oriented with the data in the excel file:- The first column contains the temperature gradient values that were used during the experiment. A thermocyler was used to expose the samples to the exact temperature.
- At each temperature, a fluorescence measurement was acquired for each sample. The fluorescence data is represented by the first derivative values provided in the excel file. For each condition, triplicate samples were tested and the average is provided in the yellow columns. For example, for FKBP12 w/ DMSO the data for the triplicate samples are in columns B-D and the average is in column E.
- To find the Tm for each condition, scroll through the column containing the averages and identify the lowest value of the first derivative curve. The temperature associated with this value is the Tm.
The Tm values for each condition represented in the graph are provided in the table to the right. Confirm the Tm value for the FKBP12 w/ DMSO control using the information above.
In addition to using the DSF results to choose your ligand for the in vivo assay, you can also consider the structural features of the ligands. To find this information, open the excel file with the chemical structure details (linked here).
- To visualize the structures of the ligands, open ChemDraw on one of the 20.109 computers.
- Copy the SMILES of the compound (from column A of the Excel spreadsheet).
- In ChemDraw, go to Edit / Paste Special... and choose SMILES.
- You can now visualize the chemical structure of the ligands with high resolution, and save this image for your Mini-report.
Using the DSF results and chemical structures, consider which ligand you want to test. Why do you think this ligand will bind FKBP12? Work with your laboratory partner to develop a hypothesis.
Before you leave class, you must sign-up for a ligand at the front laboratory bench!
Reagents list
- Mouse embryonic fibroblast (MEF) cells (a gift from the Engelward Laboratory)
- Dulbecco's Modified Eagle's Medium (DMEM) (from Gibco), supplemented with:
- 10% fetal bovine serum (FBS) (from Atlanta Biologicals)
- 100 U/mL of antibiotic solution, containing penicillin and streptomycin (from Gibco)
- phosphate buffered saline (PBS) (from Gibco)
- trypsin (from Gibco)
- trypan blue (from VWR)
- incubator maintains 37°C, 5% CO2 and 95% relative humidity
Next day: Incubate with ligand and apply heat treatment for protein denaturation


