Difference between revisions of "20.109(S21):M3D2"
Noreen Lyell (Talk | contribs) (→Part 2: Review IPC structural elements) |
(→Part 2: Review expression system used to express IPC and IPC variants) |
||
| (38 intermediate revisions by one user not shown) | |||
| Line 5: | Line 5: | ||
==Introduction== | ==Introduction== | ||
| − | + | In the previous laboratory session, you examined the structural features of IPC. The goal of this was to consider which residues are important to affinity and / or cooperativity. Today you will consider the mutations that were generated in IPC by previous 109ers and review how IPC and the IPC variants were expressed and purified as this is the first step in testing how the variants perform as calcium sensors. | |
| − | [[Image:Sp16 | + | [[Image:Sp16 M1D4 pRSET vector map.png|thumb|right|350px|'''Schematic of pRSET expression plasmid.''' Modified from Invitrogen manual.]] The genetic sequences that encode the IPC protein and IPC variant proteins are maintained within the pRSET expression vector (recall the cloning exercise from M3D1!). This expression vector contains several features that are important to the expression and purification of IPC and the IPC variants. To enable selection of bacterial cells that carry pRSET_IPC, an antibiotic cassette, specifically an ampicillin marker, is included on the vector. The features most relevant to protein expression and purification are highlighted in the schematic to the right. The T7 promoter drives expression of the gene that encodes IPC (or IPC variant). To ensure that the transcript is translated into a protein, a ribosome binding site (RBS) is included. The ATG sequence serves as the transcriptional start and the 6xHis represents the six-histidine residue tag that is used for protein purification via affinity chromatography. |
| − | + | There are some similarities between the expression system used to purify TDP43-RRM12 in Mod 2 and the system we will use for IPC. First, in both expression systems IPTG is used to induce protein production. As a review, IPTG is a lactose analog that induces expression by binding to the LacI repressor. When bound to IPTG, the LacI repressor is not able to bind to the ''lac'' operator sequence and transcription occurs unimpeded. For more details please review to the [[20.109(S21):M2D1#Introduction |M2D1 Introduction]]! Another similarity is that a 6xHis tag is used and 6xHis-tagged IPC and IPC variants will purified using column affinity as shown in the image below. | |
| − | + | [[Image:Fa20 M2D1 protein purification.png|thumb|550px|center|'''Schematic of affinity separation process.''' For purification, agarose beads (yellow) are coated with nickel (green). When cell lysate is added to the nickel-coated agarose beads, His-tagged protein of interest (blue) adheres to the beads and other proteins in the lysate (orange) are washed from the beads.]] | |
==Protocols== | ==Protocols== | ||
| − | ===Part 1: Identify IPC | + | ===Part 1: Identify mutations in Variant IPC proteins=== |
| − | + | In an effort to gain further insight into calcium affinity / cooperativity of the IPC calcium sensor, you will analyze the data generated from six Variant IPC proteins. The first step in this process is to identify the mutations that were incorporated into the Variant IPC sequences. To do this you will perform sequence alignments (just as you did on M1D5!). If you need a refresher, please watch the video tutorial for aligning sequence reads using SnapGene (linked [https://youtu.be/FbJAVg7eE3Y here]). | |
| − | # | + | |
| − | #* | + | #The sequencing files for the Variant IPC are located in the Sp21 Class Data Dropbox (linked [https://www.dropbox.com/sh/ag9zbonq6qqn19o/AAARaOvyerUQi9bzBXJt009fa?dl=0 here]). Each Variant was sequenced using a forward and reverse primer. |
| − | #* | + | #First examine the sequencing results from Genewiz by reviewing the data files. |
| − | + | #*Open the .abi files for Variant #1 IPC. | |
| − | #* | + | #**Remember that the chromatogram provides information regarding the quality of the sequence data. |
| − | #* | + | #*Open the .seq files for Variant #1 IPC. |
| − | # | + | #**This file contains the base calls, which were assigned by the software from the chromatogram, for the sequencing reaction. The .seq file is what you will use for the alignment. |
| − | # | + | #To align the sequencing from the Variant #1 IPC, open the WT IPC file that you created on M3D1. |
| − | #* | + | #From the 'Tools' menu, select 'Align to reference DNA sequence'. The select 'Align Imported Sequences'. |
| − | # | + | #Choose the .abi files for all of the Variant IPC sequences. |
| − | # | + | #In the top left panel, check the boxes for the Variant #1 IPC sequences. |
| − | #* | + | #*This adds the sequences and trace data to the lower right panel. |
| − | # | + | #*Use the grey scroll bar at the bottom of this window to view the entire alignment. |
| − | # | + | #Use the grey triangles to the left of the sequence name to expand the sequence or trace information. |
| + | #*Click on the sequence or trace icon to toggle between views. | ||
| + | #Place your cursor in the original sequence just upstream of the first sequencing alignment. | ||
| + | #At the top of the lower left panel, next to the 'Original Sequence' label, is a pink box with arrows on either side. | ||
| + | #Click on the right arrow to advance to the first mismatch or sequence gap. | ||
| + | #Use the sequence or trace file from the sequencing result to determine whether the mismatch or gap is a mutation or an unreliable sequencing result. | ||
| + | #*Remember reliable sequencing results typically start 40-50 bases downstream of the primer binding site. An 'N' indicates that the sequencing software was unable to call a base at that location. | ||
| + | #*Use the trace information to distinguish between a mismatch / gap or unreliable sequence. | ||
| + | #<font color = #4a9152 >'''In your laboratory notebook,'''</font color>, complete the following: | ||
| + | #*Include a screenshot of the sequence alignment for the mutation or gap. | ||
| + | #*Record the '''amino acid number(s)''' at which the mutation or gap occurred in the sequence. | ||
| + | #**Include the amino acid substitution (written as X123Y) for mutations or the range of amino acids that are missing for gaps (written as Δ123-234). | ||
| + | #*Describe the location of the mutation or gap (i.e. is it in a binding loop? which one?). | ||
| + | #Complete the above steps with the sequencing results from each of the Variant IPC. | ||
#<font color = #4a9152 >'''In your laboratory notebook,'''</font color> complete the following: | #<font color = #4a9152 >'''In your laboratory notebook,'''</font color> complete the following: | ||
| − | #* | + | #*Consider the implications of the mutations identified in the sequencing results for the Variant IPC proteins: |
| − | #* | + | #**If there is an amino acid substitution, include how the properties between the amino acids differ. How might this alter binding to calcium? How might this alter the structural integrity of CaM (consider whether it is plausible that the amino acids are involved in maintaining the structural integrity of the protein)? |
| − | #* | + | #**If there is a gap, include the properties for the amino acids that are now missing. How might this alter binding to calcium? How might this alter the structural integrity of CaM (consider whether it is plausible that the amino acids are involved in maintaining the structural integrity of the protein)? |
| − | + | #*Do the locations of the mutations occur in areas that you identified as interesting during the previous laboratory session? | |
| + | #*How do you hypothesize the mutations will effect affinity and / or cooperativity? | ||
| − | ===Part 2: Review IPC | + | ===Part 2: Review expression system used to express IPC and IPC variants=== |
| − | + | As mentioned above, IPTG is used to induce protein production in the expression systems for TDP43-RRM12 and IPC; however, the mechanism that drives transcription of the gene that encodes the protein of interest is different. For IPC and the IPC variants, the proteins are expressed using the BL21(DE3)pLysS strain of ''E. coli'', which has the following genotype: F<sup>-</sup>, ''omp''T ''hsd''SB (r<sub>B</sub><sup>-</sup> m<sub>B</sub><sup>-</sup>) ''gal dcm'' (DE3) pLysS (Cam<sup>R</sup>). | |
| − | + | The expression vector, pRSET, encodes the bacteriophage T7 promoter, which is active only in the presence of T7 RNA polymerase (T7RNAP), an enzyme that therefore must be expressed by the bacterial strain used to make the protein of interest. In BL21(DE3), T7RNAP is associated with a ''lac'' construct. Constitutively expressed ''lac'' repressor (''lac''I gene) blocks expression from the ''lac'' promoter; thus, the polymerase will not be produced except in the presence of repressor-binding lactose or a small-molecule lactose analogue such as IPTG (isopropyl β-D-thiogalactoside). To reduce ‘leaky’ expression of the protein of interest (in our case, IPC), the pLysS version of BL21(DE3) contains T7 lysozyme, which inhibits basal transcription of T7RNAP. This gene is retained by chloramphenicol selection, while the pRSET plasmid itself (and thus IPC) is retained by ampicillin selection. | |
| − | + | ||
| − | + | ||
| − | + | ||
| − | + | ||
| − | + | ||
| − | + | ||
| − | + | ||
| − | + | ||
| − | + | ||
| − | + | ||
| − | + | ||
| − | + | ||
| − | + | ||
| − | + | ||
| − | + | ||
| − | + | The pRSET_IPC and pRSET_IPC variants were transformed into chemically competent BL21(DE3)pLysS using heat shock as described previously. To review this method, look back at the information provided on [[20.109(S21):M1D3#Part_3:_Transform_plasmid_from_yeast_into_E._coli |M1D3]]! | |
| − | + | [[Image:Sp16 M1D4 protein expression system.png|thumb|center|600px|'''Overview of protein expression system used for IPC purification.''']] | |
| − | + | ||
| − | #** | + | <font color = #4a9152 >'''In your laboratory notebook,'''</font color> complete the following: |
| − | + | *Think carefully about how the '''expression of the genes''' and the '''activity of proteins''' is controlled by the presence / absence of IPTG in the expression system used to purify IPC. | |
| + | **The genes for which of the following proteins are expressed in the absence of IPTG: LacI repressor, T7 lysozyme, T7 RNA polymerase, ''E. coli'' RNA polymerase, protein of interest? | ||
| + | **The genes for which of the following proteins are expressed in the presence of IPTG: LacI repressor, T7 lysozyme, T7 RNA polymerase, ''E. coli'' RNA polymerase, protein of interest? | ||
| + | **The activity for which of the following proteins is directly controlled by IPTG: LacI repressor, T7 lysozyme, T7 RNA polymerase, ''E. coli'' RNA polymerase, protein of interest? | ||
| + | |||
| + | ===Part 3: Evaluate purified IPC=== | ||
| + | |||
| + | Using methods similar to what was discussed in Mod2, the gene encoding IPC was cloned into an expression vector. The expression vector was transformed into ''E. coli'' cells, then IPC expression was induced and purified. For a bit more detail on this, review the Introduction on this page. If you are curious about the similarities / differences between the experimental approaches used in Mod1 and Mod2, the Instructors can provide more detail. | ||
| + | |||
| + | To evaluate the purified IPC protein, we will use the same methods as when we assessed purified TDP43-RRM12: SDS-PAGE and microBCA (this is a variation of the BCA procedure that is used to measure lower protein concentrations). To review these methods, look back at the information provided on [[20.109(S21):M2D2 |M2D2]]! | ||
| + | |||
| + | To get you started on your analysis, note that the expected molecular weight for inverse pericam is 47 kDa. Because our IPC protein contains a 3 kDa 6xHis tag, the expected size of purified WT IPC protein is 50 kDa. | ||
| + | |||
| + | '''Assess purity using SDS-PAGE''' | ||
| + | |||
| + | [[Image:Sp21 M3D3 SDSPAGE.png|thumb|500px|center|'''SDS-PAGE results to examine purity of IPC and IPC variants.''' Lane order from left to right: 1. molecular weight ladder, 2. Variant #1 IPC, 3. Variant #2 IPC, 4. Variant #3 IPC, 5. Variant #4 IPC, 6. Variant #5 IPC, 7. Variant #6 IPC, and 8. WT IPC.]] | ||
| + | |||
| + | <font color = #4a9152 >'''In your laboratory notebook,'''</font color> complete the following: | ||
| + | *Evaluate the purified protein product for each of the Variant IPC and the WT IPC. | ||
| + | **Do you see a band that corresponds to the expected protein size? Edit the image of the SDS-PAGE results such that the expected band in each lane is highlighted. | ||
| + | **Attach the edited image. | ||
| + | *Are the purified protein products for each of the Variant IPC and the WT IPC pure? | ||
| + | **Estimate how much of the total protein in each purified protein product is the Variant IPC or WT IPC. (Note: this is just an estimate, do your best to gauge the percentage of Variant IPC or WT IPC protein in each sample by considering the intensities of all of the bands in the lane.) | ||
| + | |||
| + | '''Measure concentration using microBCA''' | ||
| + | |||
| + | [[Image:Sp21 M3D2 microBCA data.png|thumb|700px|center|'''microBCA results to calculate concentration of IPC and IPC variants.''']] | ||
| + | |||
| + | <font color = #4a9152 >'''In your laboratory notebook,'''</font color> complete the following: | ||
| + | *Use the microBCA data to generate a standard curve and calculate the protein concentrations for the Variant IPC and WT IPC purification samples (spreadsheet with values attached [[Media:Sp21 M3D2 microBCA data for IPC.xlsx |here]]). | ||
| + | **Attach the standard curve and the calculations for the Variant IPC and WT IPC concentration calculations. | ||
| + | *Based on the percentage you estimated above, what is the actual concentration of the Variant IPC and WT IPC in the purification samples. | ||
==Navigation links== | ==Navigation links== | ||
| − | Next day: [[20.109(S21):M3D3 | | + | Next day: [[20.109(S21):M3D3 |Evaluate effect of mutations on IPC variants ]] <br> |
| − | Previous day: [[20.109(S21):M3D1 |Review | + | Previous day: [[20.109(S21):M3D1 |Review IPC literature and examine structural characteristics]] <br> |
Latest revision as of 19:37, 29 April 2021
Contents
Introduction
In the previous laboratory session, you examined the structural features of IPC. The goal of this was to consider which residues are important to affinity and / or cooperativity. Today you will consider the mutations that were generated in IPC by previous 109ers and review how IPC and the IPC variants were expressed and purified as this is the first step in testing how the variants perform as calcium sensors.
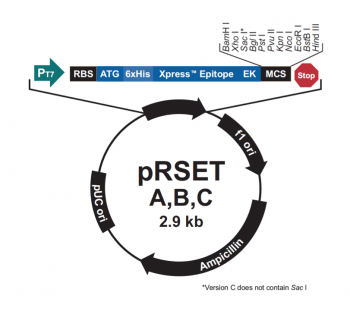
The genetic sequences that encode the IPC protein and IPC variant proteins are maintained within the pRSET expression vector (recall the cloning exercise from M3D1!). This expression vector contains several features that are important to the expression and purification of IPC and the IPC variants. To enable selection of bacterial cells that carry pRSET_IPC, an antibiotic cassette, specifically an ampicillin marker, is included on the vector. The features most relevant to protein expression and purification are highlighted in the schematic to the right. The T7 promoter drives expression of the gene that encodes IPC (or IPC variant). To ensure that the transcript is translated into a protein, a ribosome binding site (RBS) is included. The ATG sequence serves as the transcriptional start and the 6xHis represents the six-histidine residue tag that is used for protein purification via affinity chromatography.There are some similarities between the expression system used to purify TDP43-RRM12 in Mod 2 and the system we will use for IPC. First, in both expression systems IPTG is used to induce protein production. As a review, IPTG is a lactose analog that induces expression by binding to the LacI repressor. When bound to IPTG, the LacI repressor is not able to bind to the lac operator sequence and transcription occurs unimpeded. For more details please review to the M2D1 Introduction! Another similarity is that a 6xHis tag is used and 6xHis-tagged IPC and IPC variants will purified using column affinity as shown in the image below.
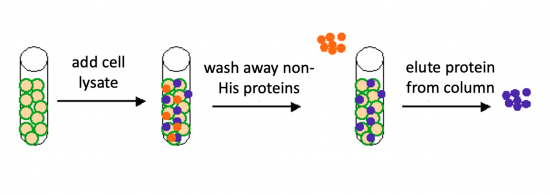
Protocols
Part 1: Identify mutations in Variant IPC proteins
In an effort to gain further insight into calcium affinity / cooperativity of the IPC calcium sensor, you will analyze the data generated from six Variant IPC proteins. The first step in this process is to identify the mutations that were incorporated into the Variant IPC sequences. To do this you will perform sequence alignments (just as you did on M1D5!). If you need a refresher, please watch the video tutorial for aligning sequence reads using SnapGene (linked here).
- The sequencing files for the Variant IPC are located in the Sp21 Class Data Dropbox (linked here). Each Variant was sequenced using a forward and reverse primer.
- First examine the sequencing results from Genewiz by reviewing the data files.
- Open the .abi files for Variant #1 IPC.
- Remember that the chromatogram provides information regarding the quality of the sequence data.
- Open the .seq files for Variant #1 IPC.
- This file contains the base calls, which were assigned by the software from the chromatogram, for the sequencing reaction. The .seq file is what you will use for the alignment.
- Open the .abi files for Variant #1 IPC.
- To align the sequencing from the Variant #1 IPC, open the WT IPC file that you created on M3D1.
- From the 'Tools' menu, select 'Align to reference DNA sequence'. The select 'Align Imported Sequences'.
- Choose the .abi files for all of the Variant IPC sequences.
- In the top left panel, check the boxes for the Variant #1 IPC sequences.
- This adds the sequences and trace data to the lower right panel.
- Use the grey scroll bar at the bottom of this window to view the entire alignment.
- Use the grey triangles to the left of the sequence name to expand the sequence or trace information.
- Click on the sequence or trace icon to toggle between views.
- Place your cursor in the original sequence just upstream of the first sequencing alignment.
- At the top of the lower left panel, next to the 'Original Sequence' label, is a pink box with arrows on either side.
- Click on the right arrow to advance to the first mismatch or sequence gap.
- Use the sequence or trace file from the sequencing result to determine whether the mismatch or gap is a mutation or an unreliable sequencing result.
- Remember reliable sequencing results typically start 40-50 bases downstream of the primer binding site. An 'N' indicates that the sequencing software was unable to call a base at that location.
- Use the trace information to distinguish between a mismatch / gap or unreliable sequence.
- In your laboratory notebook,, complete the following:
- Include a screenshot of the sequence alignment for the mutation or gap.
- Record the amino acid number(s) at which the mutation or gap occurred in the sequence.
- Include the amino acid substitution (written as X123Y) for mutations or the range of amino acids that are missing for gaps (written as Δ123-234).
- Describe the location of the mutation or gap (i.e. is it in a binding loop? which one?).
- Complete the above steps with the sequencing results from each of the Variant IPC.
- In your laboratory notebook, complete the following:
- Consider the implications of the mutations identified in the sequencing results for the Variant IPC proteins:
- If there is an amino acid substitution, include how the properties between the amino acids differ. How might this alter binding to calcium? How might this alter the structural integrity of CaM (consider whether it is plausible that the amino acids are involved in maintaining the structural integrity of the protein)?
- If there is a gap, include the properties for the amino acids that are now missing. How might this alter binding to calcium? How might this alter the structural integrity of CaM (consider whether it is plausible that the amino acids are involved in maintaining the structural integrity of the protein)?
- Do the locations of the mutations occur in areas that you identified as interesting during the previous laboratory session?
- How do you hypothesize the mutations will effect affinity and / or cooperativity?
- Consider the implications of the mutations identified in the sequencing results for the Variant IPC proteins:
Part 2: Review expression system used to express IPC and IPC variants
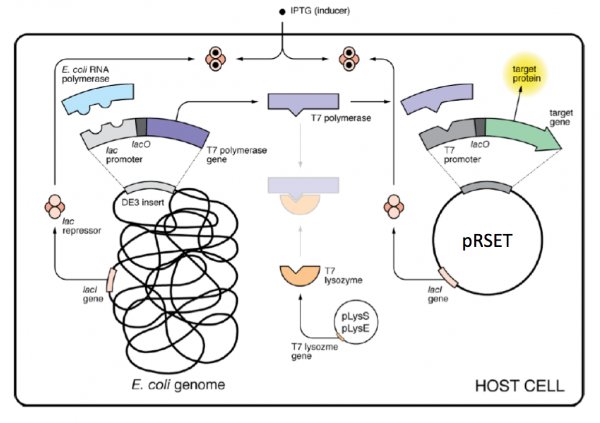
As mentioned above, IPTG is used to induce protein production in the expression systems for TDP43-RRM12 and IPC; however, the mechanism that drives transcription of the gene that encodes the protein of interest is different. For IPC and the IPC variants, the proteins are expressed using the BL21(DE3)pLysS strain of E. coli, which has the following genotype: F-, ompT hsdSB (rB- mB-) gal dcm (DE3) pLysS (CamR).
The expression vector, pRSET, encodes the bacteriophage T7 promoter, which is active only in the presence of T7 RNA polymerase (T7RNAP), an enzyme that therefore must be expressed by the bacterial strain used to make the protein of interest. In BL21(DE3), T7RNAP is associated with a lac construct. Constitutively expressed lac repressor (lacI gene) blocks expression from the lac promoter; thus, the polymerase will not be produced except in the presence of repressor-binding lactose or a small-molecule lactose analogue such as IPTG (isopropyl β-D-thiogalactoside). To reduce ‘leaky’ expression of the protein of interest (in our case, IPC), the pLysS version of BL21(DE3) contains T7 lysozyme, which inhibits basal transcription of T7RNAP. This gene is retained by chloramphenicol selection, while the pRSET plasmid itself (and thus IPC) is retained by ampicillin selection.
The pRSET_IPC and pRSET_IPC variants were transformed into chemically competent BL21(DE3)pLysS using heat shock as described previously. To review this method, look back at the information provided on M1D3!
In your laboratory notebook, complete the following:
- Think carefully about how the expression of the genes and the activity of proteins is controlled by the presence / absence of IPTG in the expression system used to purify IPC.
- The genes for which of the following proteins are expressed in the absence of IPTG: LacI repressor, T7 lysozyme, T7 RNA polymerase, E. coli RNA polymerase, protein of interest?
- The genes for which of the following proteins are expressed in the presence of IPTG: LacI repressor, T7 lysozyme, T7 RNA polymerase, E. coli RNA polymerase, protein of interest?
- The activity for which of the following proteins is directly controlled by IPTG: LacI repressor, T7 lysozyme, T7 RNA polymerase, E. coli RNA polymerase, protein of interest?
Part 3: Evaluate purified IPC
Using methods similar to what was discussed in Mod2, the gene encoding IPC was cloned into an expression vector. The expression vector was transformed into E. coli cells, then IPC expression was induced and purified. For a bit more detail on this, review the Introduction on this page. If you are curious about the similarities / differences between the experimental approaches used in Mod1 and Mod2, the Instructors can provide more detail.
To evaluate the purified IPC protein, we will use the same methods as when we assessed purified TDP43-RRM12: SDS-PAGE and microBCA (this is a variation of the BCA procedure that is used to measure lower protein concentrations). To review these methods, look back at the information provided on M2D2!
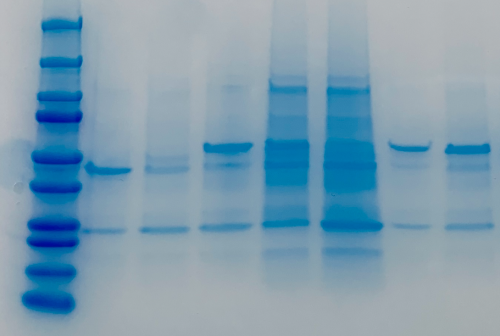
To get you started on your analysis, note that the expected molecular weight for inverse pericam is 47 kDa. Because our IPC protein contains a 3 kDa 6xHis tag, the expected size of purified WT IPC protein is 50 kDa.
Assess purity using SDS-PAGE
In your laboratory notebook, complete the following:
- Evaluate the purified protein product for each of the Variant IPC and the WT IPC.
- Do you see a band that corresponds to the expected protein size? Edit the image of the SDS-PAGE results such that the expected band in each lane is highlighted.
- Attach the edited image.
- Are the purified protein products for each of the Variant IPC and the WT IPC pure?
- Estimate how much of the total protein in each purified protein product is the Variant IPC or WT IPC. (Note: this is just an estimate, do your best to gauge the percentage of Variant IPC or WT IPC protein in each sample by considering the intensities of all of the bands in the lane.)
Measure concentration using microBCA
In your laboratory notebook, complete the following:
- Use the microBCA data to generate a standard curve and calculate the protein concentrations for the Variant IPC and WT IPC purification samples (spreadsheet with values attached here).
- Attach the standard curve and the calculations for the Variant IPC and WT IPC concentration calculations.
- Based on the percentage you estimated above, what is the actual concentration of the Variant IPC and WT IPC in the purification samples.
Next day: Evaluate effect of mutations on IPC variants
