Difference between revisions of "20.109(F16):Data analysis (Day7)"
(→Part 1: Visualize H2AX assay results) |
(→Part 1: Visualize H2AX assay results) |
||
| Line 16: | Line 16: | ||
===Part 1: Visualize H2AX assay results=== | ===Part 1: Visualize H2AX assay results=== | ||
| − | #Make sure to have TBS solution available before you start. Aspirate the secondary antibody solution and immediately add 150 μL of TBS | + | #Make sure to have TBS solution available before you start. Aspirate the secondary antibody solution off the coverslip and immediately add 150 μL of TBS. Do not let the coverslips dry out during this process. |
#To complete the post secondary wash, add 150 μL of TBS per coverslip, let incubate at room temperature for 3min covered, then aspirate. | #To complete the post secondary wash, add 150 μL of TBS per coverslip, let incubate at room temperature for 3min covered, then aspirate. | ||
#*Repeat this step a total of two times. | #*Repeat this step a total of two times. | ||
Revision as of 21:04, 31 August 2016
Contents
Introduction
As a brief reminder, two antibodies were used in the gamma-H2AX assay. The first antibody, or primary antibody, was anti-gamma-H2AX and raised in a mouse. The secondary antibody was anti-mouse and raised in a goat, more importantly, this molecule is conjugated to a fluorescent dye tag called Alexa Fluor 488. The Alexa Fluor 488 tag is a bright, green fluorescent dye that is excited at 488 nm. To visualize the abundance of double-strand breaks in your H2AX assay samples, we will use fluorescence microscopy.
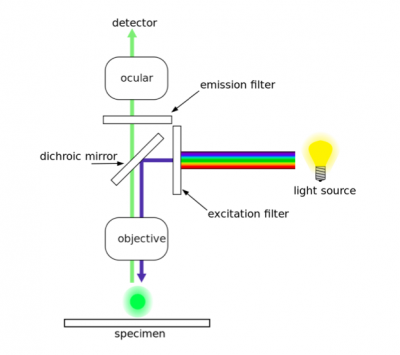
In fluorescence microscopy the specimen is illuminated with a wavelength of light specific to the excitation of the fluorescent tag used to target the feature of interest. The excitation wavelength is absorbed by the fluorescent tag, which causes it to emit light at a longer, less energetic wavelength. Typically, fluorescence microscopes used in biology are an epifluorescence type with a single light path (the objective) for excitation and emission detection, as depicted in the diagram above.
Fluorescence, or epifluorescence, microscopes are composed of a light source, an excitation filter, a dichroic mirror, and an emission filter. The filters and the dichroic mirror are specific to the spectral excitation and emission characteristics of the fluorescent tag. To visualize fluorescence, light at the excitation wavelength is focused on the sample. The light emission from the sample is focused by the objective to a detector.
Today you will image the samples you tested using the gamma-H2AX assay and complete a short summary that qualitatively interprets the data.
Protocols
Part 1: Visualize H2AX assay results
- Make sure to have TBS solution available before you start. Aspirate the secondary antibody solution off the coverslip and immediately add 150 μL of TBS. Do not let the coverslips dry out during this process.
- To complete the post secondary wash, add 150 μL of TBS per coverslip, let incubate at room temperature for 3min covered, then aspirate.
- Repeat this step a total of two times.
- Obtain glass slides from the front laboratory bench and label your glass slides with all of your experimental information and group name, add 5 μL of mounting media to the slide.
- Aspirate the final TBS wash and using tweezers place the coverslip cell-side down on the mounting media "spot" on the microscope slide. Try your best to avoid bubbles by slowly placing the coverslip over the mounting media.
- The cell-side of the coverslide is the side that was facing up in the staining chamber.
- Complete Steps #5-7 for coverslips from the H2O2 treated and control wells for both cell lines.
- Alert the teaching faculty when all four microscope slides are ready and you will be escorted to the microscope in the Engelward laboratory.
Part 2: Data analysis for H2AX assay
Reagents
Next day: [[
Previous day: Complete immuno-fluorescence assay
