Spring 2011:Optical Trapping Lab
Team Humble
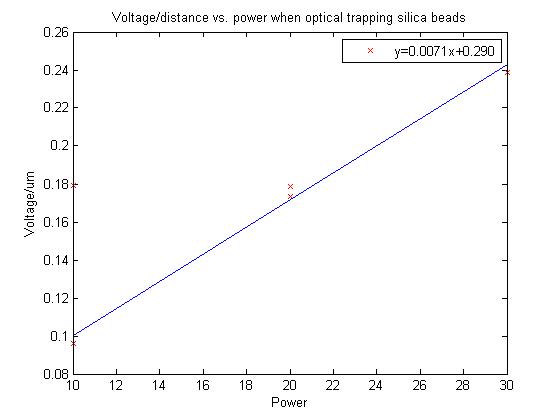
XY position detector calibration
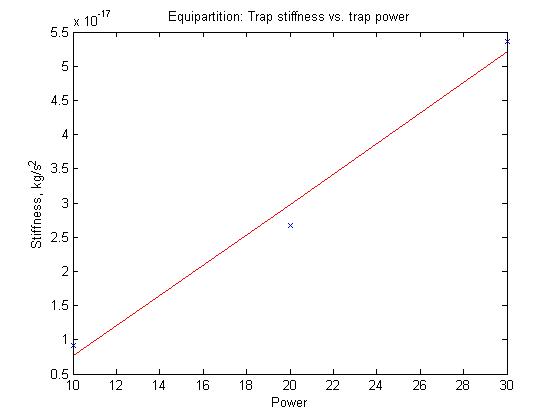
Trap stiffness by equipartition theorem
These values are off by about 8 orders of magnitude. This graph is up temporarily until I figure out what is going wrong with my calculations.
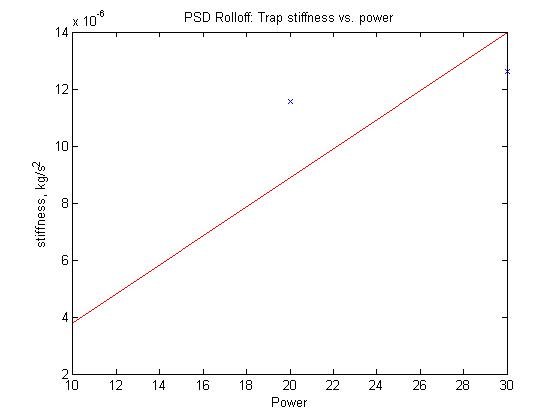
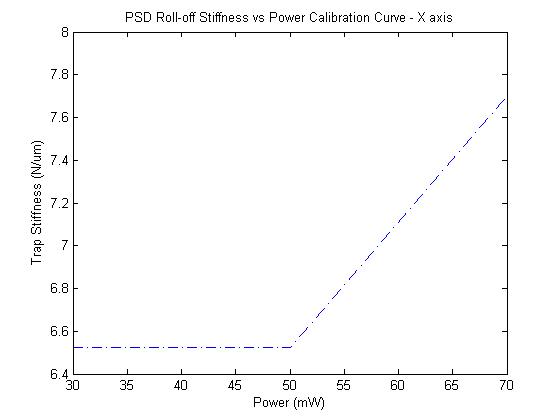
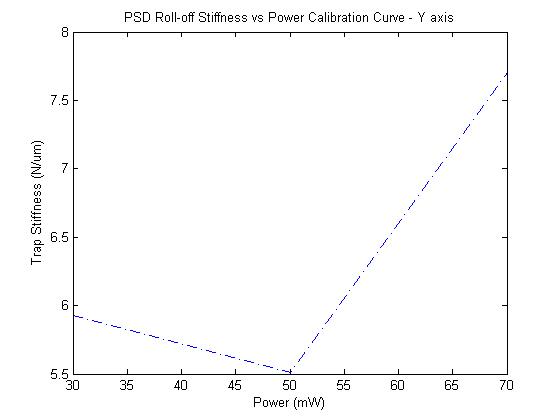
Trap stiffness by PSD rolloff
These values are about 2 orders of magnitude larger than those found in the OTKB document.
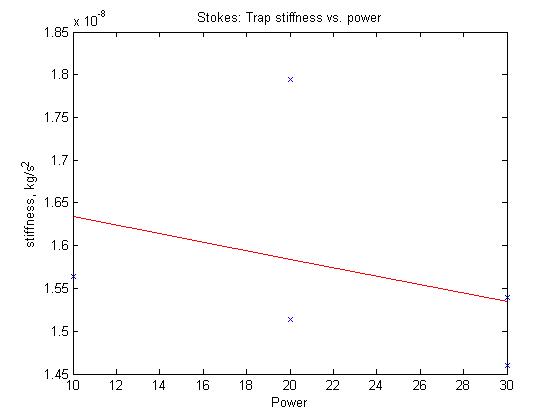
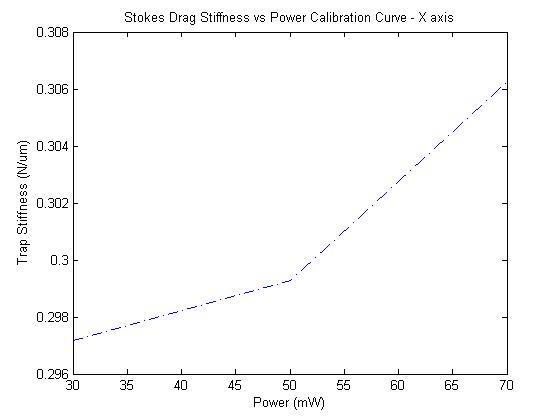
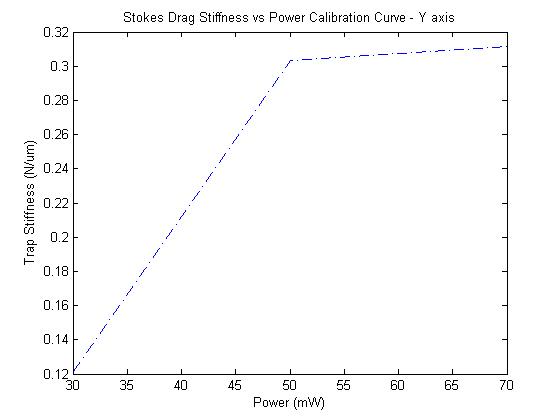
Trap stiffness by Stokes' theorem
These values are about the correct order of magnitude, but the slope of the graph should be positive, not negative! Again, this graph is up temporarily until I can figure out what data processing mistakes are going on.
Team Watson
XY position detector calibration
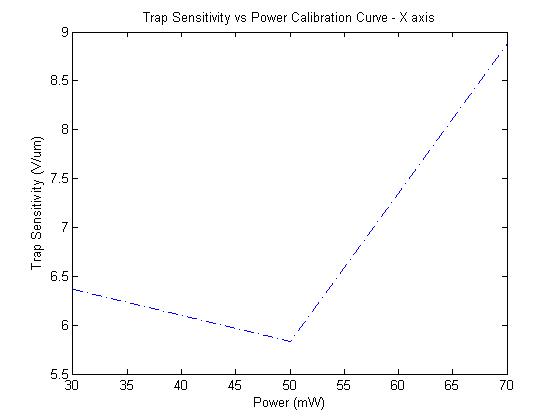
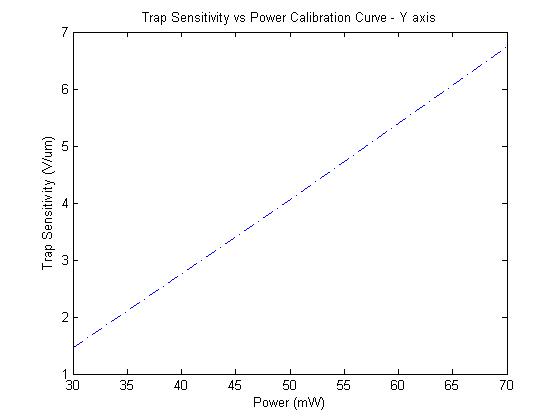
Although the Y axis plot looks OK, I'm not sure of what happened to the X axis one
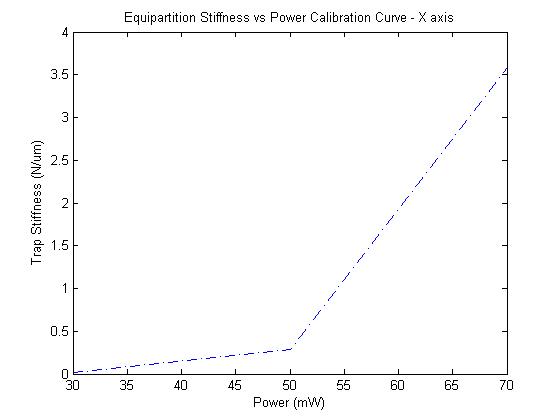
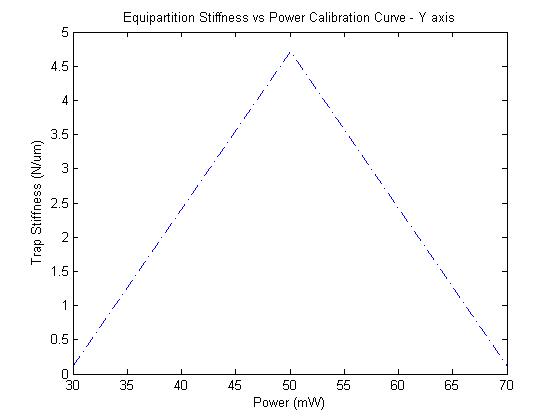
Trap stiffness by equipartition theorem
The X-axis plot follows the expected trend of higher stiffness with higher power, but the Y axis has a very off-line measurement, although the orders of magnitude seem right.
Trap stiffness by PSD rolloff
Both of these plots are right around the expected value, although they are around twice the values found for the Equipartition method (maybe there are some conversion errors).
Trap stiffness by Stokes' theorem
Finally, this method seems to follow the expected trend, but its values are around an order of magnitude off from the previous methods. Again, this may be due to unit conversion issues (currently revising).

