Assignment 8, Part 1: convolution
From Course Wiki
Revision as of 22:56, 17 August 2017 by MAXINE JONAS (Talk | contribs)

This is Part 1 of Assignment 8.
| |
your answers to the following questions |
- Convolution practice
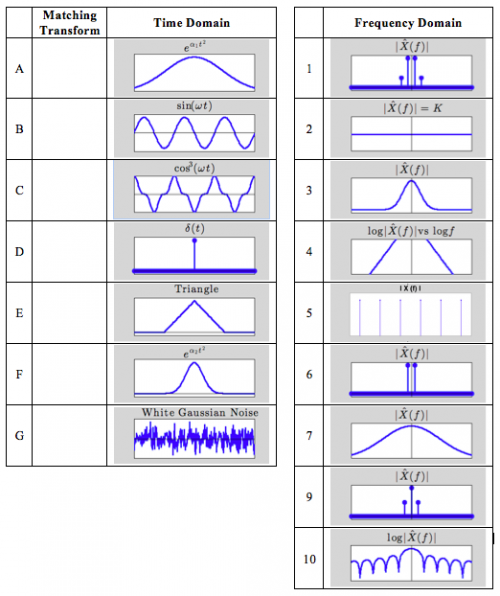

Table 8.1.1 Table 8.1.1 shows plots of eight time-domain signals A-H. The table on the right includes magnitude plots of the Fourier transform of ten signals numbered 1-10. For each time domain signal A-H, write the number 1-10 in the empty column of the matching frequency-domain signal. You may use a numbered plot more than once.
Some of the frequency plots are shown on log-log axes and some are linear, as indicated by the plot title.
- DNA lab lock-in amplifier
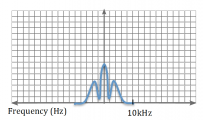
Figure 8.1.1
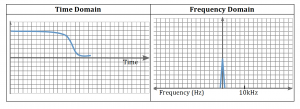
Figure 8.1.2: Time (left) and frequency (right) domain of LED illumination


