Difference between revisions of "20.109(F22):M2D6"
Noreen Lyell (Talk | contribs) (→Protocols) |
Noreen Lyell (Talk | contribs) (→Protocols) |
||
| Line 8: | Line 8: | ||
==Protocols== | ==Protocols== | ||
| − | ===Part | + | ===Part 1: Examine binding shifts=== |
You will receive two Excel sheets containing raw data from each well of a 384 well plate over the specified range of temperatures. The Excel sheet with "Melt Curve RFU Results" in the file name will contain raw fluorescence intensity data, while the other sheet with "Melt Curve Derivative Results" in its name will have the values for the first derivative of the melt curve. The teaching faculty will inform you which wells correspond to which conditions for your group. | You will receive two Excel sheets containing raw data from each well of a 384 well plate over the specified range of temperatures. The Excel sheet with "Melt Curve RFU Results" in the file name will contain raw fluorescence intensity data, while the other sheet with "Melt Curve Derivative Results" in its name will have the values for the first derivative of the melt curve. The teaching faculty will inform you which wells correspond to which conditions for your group. | ||
| Line 36: | Line 36: | ||
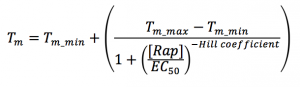
#**This file performs nonlinear regression using the following equation, where the fit parameters include Tm_min (minimum Tm at no ligand concentration, Tm_max (maximum Tm at infinite ligand concentration, and EC<sub>50</sub> is the EC<sub>50</sub> or apparent K<sub>D</sub> value, and a Hill coefficient which should not be meaningful in this context. | #**This file performs nonlinear regression using the following equation, where the fit parameters include Tm_min (minimum Tm at no ligand concentration, Tm_max (maximum Tm at infinite ligand concentration, and EC<sub>50</sub> is the EC<sub>50</sub> or apparent K<sub>D</sub> value, and a Hill coefficient which should not be meaningful in this context. | ||
#**[[File:EC50equation.png|300px|center]] | #**[[File:EC50equation.png|300px|center]] | ||
| + | |||
| + | ===Part 2: Organize figures and outline results text for your Research article=== | ||
| + | |||
| + | The goal for today is to focus on how you will communicate the results you are gathering and analyzing in the Research article. | ||
| + | |||
| + | Currently, you have partial drafts and outlines for each of the sections (with Instructor feedback!) that will be included in the Research article. Today you will organize and write a detailed outline for the data that you collected for this module. Use the skills you learned when you completed the figure homework and apply them to the remaining figures for your Research article. | ||
| + | |||
| + | To get started on this process, complete the following: | ||
| + | |||
| + | #Make a list of all of the schematics / data figures / tables that will be included. | ||
| + | #Organize the figures such that the data tell a coherent story that answers your research question. | ||
| + | #Complete the following steps for each figure: | ||
| + | #*Write a conclusive figure title that relays the main take-home message for the data shown. | ||
| + | #*Write a results subsection title that mimics the figure title. | ||
| + | #*Outline the text that will be included in the results subsection using the prompts included in the Results section of [[20.109(F22):Research_article#Results| Research article]] page. | ||
| + | |||
| + | <font color = #4a9152 >'''In your laboratory notebook,'''</font color> complete the following: | ||
| + | |||
| + | *Include the list of schematics / data figures / tables. | ||
| + | *For each schematic / data figure / table, provide an outline of the information that will included in the text of the results section. | ||
==Reagents list== | ==Reagents list== | ||
Revision as of 14:38, 7 November 2022

Contents
Introduction
Protocols
Part 1: Examine binding shifts
You will receive two Excel sheets containing raw data from each well of a 384 well plate over the specified range of temperatures. The Excel sheet with "Melt Curve RFU Results" in the file name will contain raw fluorescence intensity data, while the other sheet with "Melt Curve Derivative Results" in its name will have the values for the first derivative of the melt curve. The teaching faculty will inform you which wells correspond to which conditions for your group.
One basic way to determine the "melting temperature," or Tm of the protein is to determine temperature at the inflection point of the melting curve. This inflection point would occur at the maximum value of the first derivative. The BioRad CFX machine we use actually exports the negative of the first derivative in the Excel file, so we will find the minimum value in the first derivative Excel file, and take the corresponding temperature to be the Tm of FKBP12 in each condition.
- Open the Excel file corresponding to the first derivative data
- Column B should contain temperature information in Celsius.
- At a row on the bottom of column C, type in the following command: =INDEX($B$FirstRow:$B$LastRow, MATCH(MIN(CFirstRow:CLastRow),CFirstRow:CLastRow,0)), where FirstRow corresponds to the row number of the first row containing data, and LastRow contains the row number of the last row containing data.
- Press enter, and double check that the listed temperature occurs at the minimum value of the first derivative.
- Then, drag the bottom left corner of the cell across all relevant columns to apply the formula to those columns of interest.
- Plot the columns relevant to your data set by making a scatter plot ("straight marked scatter"), having the temperature (values in column B) on the x-axis, and the first derivative values on the y-axis.
- Double check by eye that the values you calculated to be the melting temperatures correspond to the minimum values on the curves. (See example plot in the introduction section of this wiki page)
- Next, you may also check to see what the melting curves look like in terms of raw fluorescence by plotting fluorescence intensity vs. temperature in the "Melt Curve RFU Results" file. Again, validate the results you found by eye to see if the Tms correspond to the inflection point of the raw fluorescence melt curves.
- Check to see if the Tm of the control protein shifted when its ligand was added. Quantify the shift.
- Check to see if the Tm of FKBP12 shifted when Rapamycin or other compounds were added. Quantify the shifts.
- By varying the concentration of Rapamycin, you will be able to determine an apparent dissociation constant of Rapamycin and FKBP12. Here is the reference for finding the apparent dissociation constant that was mentioned in lecture: https://www.ncbi.nlm.nih.gov/pmc/articles/PMC4692391/
- You may use this MATLAB script (ApparentKd.m) to help fit the Tm vs. Rapamycin concentration curve to a single binding site model and find a value for the apparent KD. The function uses a nonlinear regression.
- Based on the given article linked above, the single binding site model is as follows, where the fit parameters include Tm_min (minimum Tm at no ligand concentration), Tm_max (maximum Tm at infinite ligand concentration), and KD is the apparent KD value. For our experiment, the concentration of FKBP12 (written as [FKBP12]) was 8.5 uM and the concentration of Rapamycin (written as [Rap]) was variable.

- Create an array of Rapamycin concentrations by typing RapConc = [A, B, C, D, E, etc.] at the MATLAB command prompt, where A, B, C are the various Rapamycin concentrations in units of uM.
- The 10 concentrations of Rapamycin are: 20uM, 10uM, 5uM, 1uM, 0.1uM, 0.05uM, 0.01uM, 0.005uM, 0.001uM, and 0.0001uM
- Create an array of Tms by typing Tm = [A2, B2, C2, D2, E2, et c.] at the MATLAB command prompt, where A2, B2, C2 are Tms corresponding to concentrations A, B, and C in the previous array.
- Making sure the MATLAB function ApparentKd.m is in your current working directory, type in ApparentKd(RapConc, Tm) at the command prompt and press enter
- The function performs a nonlinear regression of your data with a single binding site model, and will return an apparent KD value in units of uM from the best fit.
- If this regression does not work well, you may use alternative methods to estimate an apparent KD value
- You can find the EC50 value by fitting with the following formula in this matlab function EC50.m
- Making sure the MATLAB function EC50.m is in your current working directory, type in EC50(RapConc, Tm) at the command prompt and press enter
- This file performs nonlinear regression using the following equation, where the fit parameters include Tm_min (minimum Tm at no ligand concentration, Tm_max (maximum Tm at infinite ligand concentration, and EC50 is the EC50 or apparent KD value, and a Hill coefficient which should not be meaningful in this context.
- You may use this MATLAB script (ApparentKd.m) to help fit the Tm vs. Rapamycin concentration curve to a single binding site model and find a value for the apparent KD. The function uses a nonlinear regression.


Part 2: Organize figures and outline results text for your Research article
The goal for today is to focus on how you will communicate the results you are gathering and analyzing in the Research article.
Currently, you have partial drafts and outlines for each of the sections (with Instructor feedback!) that will be included in the Research article. Today you will organize and write a detailed outline for the data that you collected for this module. Use the skills you learned when you completed the figure homework and apply them to the remaining figures for your Research article.
To get started on this process, complete the following:
- Make a list of all of the schematics / data figures / tables that will be included.
- Organize the figures such that the data tell a coherent story that answers your research question.
- Complete the following steps for each figure:
- Write a conclusive figure title that relays the main take-home message for the data shown.
- Write a results subsection title that mimics the figure title.
- Outline the text that will be included in the results subsection using the prompts included in the Results section of Research article page.
In your laboratory notebook, complete the following:
- Include the list of schematics / data figures / tables.
- For each schematic / data figure / table, provide an outline of the information that will included in the text of the results section.
Reagents list
Next day: Evaluate protein structures