Difference between revisions of "20.109(F21):M2D1"
Noreen Lyell (Talk | contribs) (Created page with "<div style="padding: 10px; width: 820px; border: 5px solid #909497;"> {{Template:20.109(F21)}} ==Introduction== Though the theme of Module 2 is focused on screening for ...") |
Becky Meyer (Talk | contribs) (→Part 2: Visually evaluate chemical structures of putative binders) |
||
| (24 intermediate revisions by 2 users not shown) | |||
| Line 1: | Line 1: | ||
<div style="padding: 10px; width: 820px; border: 5px solid #909497;"> | <div style="padding: 10px; width: 820px; border: 5px solid #909497;"> | ||
{{Template:20.109(F21)}} | {{Template:20.109(F21)}} | ||
| − | |||
==Introduction== | ==Introduction== | ||
| + | A small molecule microarray (SMM) requires the covalent attachment of a library of small molecules to a glass slide. Our library is meant to broadly sample the drug-like chemical space (''i.e.'' all possible chemical structures that have drug-like physical properties) and contains about 50,000 small molecules. Some libraries are much smaller, while many pharmaceutical companies possess high-throughput screening (HTS) collections of millions of compounds. Because this chemical space is very large, it’s difficult to generalize any single chemical reaction for this attachment that can be applied to all small molecules. We take a “one-size-fits-most” approach, where the glass slide is functionalized with a broadly reactive electrophile capable of reacting with nucleophiles present in most drug-like small molecules, such as alcohols or amines. Many small molecules contain multiple nucleophiles suitable for attachment. In this case, our manufacturing will result in a mixture of attachment sites. It’s important to remember that attachment to the glass slide constrains the possible orientation of the protein-small molecule interaction; some orientations are not possible because the glass slide and linker are in the way. | ||
| − | + | We start with a glass slide with exposed amines across the surface and attach a short PEG (polyethylene glycol) linker. To the end of this PEG linker, an isocyanate group is attached. Isocyanate, or R-N=C=O, is a resonant structure, and a partial positive charge is stabilized on the carbon atom. This carbon atom is electrophilic, and small molecules with nucleophiles will react here. We estimate that about 70% of drug-like small molecules are amenable to this reaction, and our library is filtered to contain only these molecules. | |
| − | + | [[Image:Sp17 20.109 M1D4 SMM printing.png|thumb|700px|center|Image from Bradner, J. E. et al. [http://www.ncbi.nlm.nih.gov/pubmed/17406478 PMID: 17406478]]] | |
| − | + | Our compound library is dissolved in DMSO and stored in 384-well plates. To dispense the compounds onto our functionalized glass slide, a robotic arm with a set of 48 metal pins is used to transfer the compounds to the glass slide. Each metal pin has a small slit in the end, and capillary action is used to precisely withdraw and dispense consistent volumes. When the pins touch the glass slide, the compound in DMSO is dispensed into a small circle of approximately 160 micron in diameter. Each pin prints one compound in two different locations on each slide, and then the pins are washed in water and DMSO. This process is repeated for each compound, resulting in our final microarray. The microarray is divided into 48 subarrays, and each subarray corresponds to one pin and contains 256 discrete spots. Within each subarray, we print a set of fluorescent compounds in the shape of an ‘X’ so that we can precisely determine where each spot is printed. After the compounds react, we quench the surface so that no electrophiles remain. This results in our final microarray; a collection of approximately 12,000 discrete spots displaying one compound each. | |
| − | '' | + | (Written by Rob Wilson. For more information read Bradner, J. E., McPherson, O. M., and Koehler, A. N. (2006) ''A method for the covalent capture and screening of diverse small molecules in a microarray format.'' Nature Prot. 1:2344-2352. [http://www.ncbi.nlm.nih.gov/pubmed/17406478 PMID: 17406478].) |
| − | + | ==Protocols== | |
| − | + | ===Part 1: Review SMM experimental details=== | |
| − | + | For timing reasons, you will not perform an SMM experiment this semester. Instead you will expand on the results gathered by researchers in the Niles Laboratory to test putative small molecule binders in a secondary assay. To ensure that you are familiar with the steps used in an SMM screen, review the procedure below. | |
| − | + | ====Perform SMM screen==== | |
| − | ''' | + | <font color = #0d368e>'''To ensure the steps included below are clear, please watch the video tutorial linked here: [[https://www.dropbox.com/s/0phy1rg1w23fs49/SMM%20Staining.mp4?dl=0 SMM Screen]]. The steps are detailed below so you can follow along!'''</font color> |
| − | [[Image: | + | #Obtain two printed SMM slides from the front laboratory bench.[[Image:Sp17 20.109 M1D4 forceps.png|thumb|250px|right|Only use forceps at the barcoded end of the slide.]] |
| − | + | #*Only hold them at the barcoded end as you would otherwise disrupt the ligands that are printed on the surface. | |
| + | #Record the barcode numbers of your slides in your laboratory notebook. | ||
| + | #Carefully place each slide, barcode facing up, into a well of a 4-well chamber dish using the slide forceps.[[Image:Sp17 20.109 M1D4 pipet.png|thumb|200px|right|Add all liquid to the barcoded end of the slide.]] | ||
| + | #*Again, only hold the slide at the barcoded end. | ||
| + | #Add 3 mL of your diluted protein solution to the chambers that contain your slides. | ||
| + | #*Pipet the diluted protein solution onto the barcoded end of the slides. | ||
| + | #*Avoid generating bubbles as you add your diluted protein solution. | ||
| + | #Gently rock the 4-well chamber dish back and forth until the slides are completely covered with the diluted protein solution. | ||
| + | #Cover the 4-well chamber dish with aluminum foil and incubate on the rocking table for 1 hr. | ||
| + | #*During all incubations it is important to keep the slides covered as the fluorescein spots used for alignment during scanning are sensitive to light.[[Image:Sp17 20.109 M1D4 liquid.png|thumb|200px|right|Pour liquid from the corner of the 4-well chamber dish.]] | ||
| + | #Carefully pour the diluted protein solution from your 4-well chamber dish into a waste container by tipping the dish such that the liquid leaves the dish from the corner. | ||
| + | #*The surface tension should keep the slides in the 4-well chamber dish; however, it is good to be careful that they do not fall into the waste container. | ||
| + | #Add ~3 mL of TBS-T to the chambers that contain your slides. | ||
| + | #*Remember, pipet the liquid onto the barcoded end of the slides. | ||
| + | #*Don't 'push' the liquid across the surface of the slide with the pipet. Instead, gently rock the 4-well chamber dish back and forth to completely cover your slides. | ||
| + | #Incubate the slides on the rocking table for 2 min. | ||
| + | #*Don't forget to cover the 4-well chamber dish with aluminum foil. | ||
| + | #Pour the TBS-T from the 4-well chamber dish as above into a waste container. | ||
| + | #Complete Steps #8 - 10 a total of 3 times. | ||
| + | #Move your slides to a fresh 4-well chamber dish to eliminate carryover from the protein and/or buffer solutions. | ||
| + | #Prepare 7 mL of anti-His antibody solution in TBS-T. | ||
| + | #*Dilute the antibody stock 1:1000 at the front laboratory bench. | ||
| + | #Add 3 mL of the diluted antibody solution to the chambers that contain your slides. | ||
| + | #*Pipet the diluted antibody solution onto the barcoded end of the slides. | ||
| + | #*Avoid generating bubbles as you add your diluted antibody solution. | ||
| + | #Gently rock the 4-well chamber dish back and forth until the slides are completely covered with the diluted antibody solution. | ||
| + | #Cover the 4-well chamber dish with aluminum foil and incubate on the rocking table for 1 hr. | ||
| + | #Carefully pour the diluted antibody solution from your 4-well chamber dish into a waste container. | ||
| + | #Add ~3 mL of TBS (not TBS-T!) to remove excess detergent and incubate your covered 4-well chamber dish on the rocking table for 2 min, then pour liquid into a waste container. | ||
| + | #Lastly, wash the slides with dH<sub>2</sub>O. | ||
| + | #*Obtain 2 reservoirs and add fresh dH<sub>2</sub>O to each. | ||
| + | #*Label the reservoirs '1' and '2'. | ||
| + | #Wash each slide by removing it from the 4-well chamber dish with the slide forceps and dunking it 8 times into reservoir 1, then dunking it 8 times into reservoir 2. | ||
| + | #Dry your slides by carefully inserting your slides in the 'slide spinner' at the front laboratory bench. | ||
| + | #*Be mindful not to scrape the face of your slides on the slide holder. | ||
| + | #*Centrifuge your slides for 30 sec. | ||
| + | #Transfer your slides into fresh 50 mL conical tubes and wrap in aluminum foil. | ||
| + | #Store SMM slides at 4 °C until imaging. | ||
| − | + | ====Scan SMM slides==== | |
| − | + | After the printed SMM slides are incubated with the purified PF3D7_20109-F21 protein, the next step is to check which of the small molecules, if any, you screened may be able to bind PF3D7_20109-F21. To do this the slides are imaged using a Genepix microarray scanner. The scanner measures the fluorescence signal emitted from the slide at two wavelengths: 532 nm | |
| + | and 635 nm. The goal for today is to familiarize you with how the SMM slides are scanned and imaged. These images are the raw data that will be used to identify putative small molecule binders. | ||
| − | + | [[Image:Fa21 M2D1 SMM complex & scan.png|thumb|700px|center|'''Overview of SMM slide imaging.''' A. To visualize which small molecule is putative binder of PF3D7_20109-F21, the 6xHis-tag is labeled using an anti-His antibody that is conjugated to a fluorophore. B. The fluorophore used to label protein bound to the small molecule in a particular location on the slide emits a red signal (indicated by white arrow). Image in Panel A generated using BioRender.]]<br> | |
| − | + | When the SMM slides are imaged, the scanner exposes each slide to excitation light specific to the fluorophores used in the experiment. As shown in the figure above, two fluorophores were used to evaluate small molecule binding to PF2D7_20109-F21. The green spots represent locations on the SMM slide where fluorescein was printed. Fluorescein is a fluorescent dye that emits at 532 nm and is used for alignment purposes. Correct alignment is critical to knowing which small molecules are in which spots on the slide. Red spots are indicative of small molecules that are bound by PF3D7_20109-F21. The signal is due to an Alexa Fluor 647 anti-His antibody that emits at 635 nm. | |
| − | + | During imaging, the scanner detects the intensity of the emitted fluorescence light to generate an image that can be analyzed. The intensity and position of the 'red' signal associated with putative small molecule binders is what will be assessed in the next laboratory session. This analysis will provide a list of 'hits' that can be used in future studies to identify drug candidates. | |
| − | + | <font color = #0d368e>'''To ensure you are familiar with the steps involved in imaging the SMM experiment, please watch the video tutorial provided by a researcher from the Koehler Laboratory linked here: [https://www.dropbox.com/s/6o07ruvdtchg4ex/Scanning%20SMM.mp4?dl=0 SMM Scanning]. The steps are detailed below so you can follow along!'''</font color> | |
| − | + | #Place the slide in the scanner barcode side down. | |
| + | #Set the desired wavelengths that you want to scan. | ||
| + | #*For fluorescein: 532 nm | ||
| + | #*For Alexa Fluor 647: 635 nm | ||
| + | #Set the wavelength, filter, PMT, and power settings. | ||
| + | #Run a preview scan to optimize the PMT for the 635 nm (red) emission. | ||
| + | #Complete a full scan using the optimal PMT value. | ||
| + | #Following the scan, you will see an image of your slide as below. | ||
| − | + | <font color = #4a9152 >'''In your laboratory notebook,'''</font color> complete the following: | |
| − | + | *What color is emitted by fluorescein? What does this indicate on the scan (what is present in spots that emit this signal)? | |
| − | + | *What color is emitted by Alexa Fluor 647? What does this indicate on the scan (what is present in spots that emit this signal)? | |
| − | + | ||
| − | + | ||
| − | + | ||
| − | + | ||
| − | + | ||
| − | + | ||
| − | + | ||
| − | + | ||
| − | + | ||
| − | + | ||
| − | + | ||
| − | + | ||
| − | + | ||
| − | + | ||
| − | + | ||
| − | + | ||
| − | + | ||
| − | + | ||
| − | + | ||
| − | + | ||
| − | + | ||
| − | + | ||
| − | + | ||
| − | + | ||
| − | + | ||
| − | + | ||
| − | + | ||
| − | + | ||
| − | + | ||
| − | + | ||
| − | + | ||
| − | + | ||
| − | + | ||
| − | + | ||
| − | + | ||
| − | + | ||
| − | + | [[Image:Sp17 20.109 M1D5 Genepix scan.png|thumb|600px|center|]] | |
| − | + | ====Analyze SMM images==== | |
| − | [[Image: | + | [[Image:Sp20 M1D6 background, foreground.png|right|800px|thumb]]The microarrayer reads the fluorescence signals emitted from the surface of the SMM slide at two excitation wavelengths. As noted previously, the 532 nm wavelength was used to excite fluorescein, which was printed in an 'X' pattern to assist with alignment. The 635 nm wavelength was used to excite Alexa Fluor 647-conjugated anti-His antibody; which would be associated with PF3D7_20109-F21 bound to a small molecule on the slide. A hit denotes a spot on the slide that emits a red fluorescence signal significantly higher than the background fluorescence level. In terms of protein binding, a hit denotes that the PF3D7_20109-F21 protein is bound to a small molecule and is therefore localized to a specific position on the slide. You will analyze the fluorescence signal collected by the microarray scanner using a value termed the robust z-score. |
| − | + | The robust z-score differentiates signal from noise by providing a value that represents the intensity of a signal above background. In the case of the SMM experiment, the intensity of a fluorescent signal above the background fluorescence is calculated. To do this the fluorescence emitted across the entire slide is grouped to define the Median Absolute Deviation (MAD), which is is a measure of the variability of a univariate dataset. Though beyond the scope of this class, the equation for calculating the robust z-score assigns a value for how much more intense the fluroescent signal at a spot is over background. The higher the value, the more different the signal from background. | |
| − | + | ||
| − | + | ||
| − | + | ||
| − | + | ||
| − | + | ||
| − | + | ||
| − | + | ||
| − | + | ||
| − | + | ||
| − | + | ||
| − | + | ||
| − | + | ||
| − | + | After putative binders are identified via the robust z-score, the data are examined by-eye using the criteria discussed in the prelab. Please review the prelab notes for how this process is completed. | |
| − | + | <font color = #4a9152 >'''In your laboratory notebook,'''</font color> complete the following: | |
| + | *Why is it important to complete a by-eye inspection of the SMM results? | ||
| − | + | ===Part 2: Visually evaluate chemical structures of putative binders=== | |
| − | + | One method for assessing protein-small molecule binding is to visually inspect known small molecule binders for common features / structures. Your goal for today is to carefully examine the hits identified by the class and identify any common features / structures. As in the image below, it is possible that multiple features will be present within the same small molecule. | |
| − | + | ||
| − | + | ||
| − | + | ||
| − | + | ||
| − | + | [[Image:Sp17 20.109 M1D7 chemical structure features.png|thumb|750px|center|]] | |
| − | + | ||
| − | + | ||
| − | + | ||
| − | + | ||
| − | + | ||
| − | + | ||
| − | + | ||
| − | + | ||
| − | + | ||
| − | + | ||
| − | + | ||
| − | + | ||
| − | + | ||
| − | + | ||
| − | + | ||
| − | + | ||
| − | + | ||
| − | + | ||
| − | + | ||
| − | + | ||
| − | + | ||
| − | + | ||
| − | + | ||
| − | |||
| − | + | With your partner, review the hits that were identified in the SMM screen completed for PF3D7_20109-F21 (see table below). To see the chemical structures, translate the SMILES strings using one of the methods described in the text below the table. It may be easier to copy / paste the small molecule images into a powerpoint file so you can readily see all of the structures. Also, it may be helpful to use a color-coding system (like the one in the image provided above) to highlight features / structures that are common to the small molecules that putatively bind PF3D7_20109-F21. | |
| − | + | ||
| − | + | ||
| − | + | ||
| − | + | ||
| − | + | ||
| − | + | ||
| − | + | ||
| − | + | ||
| − | + | ||
| − | + | ||
| − | + | ||
| − | + | ||
| − | + | ||
| − | + | ||
| − | + | ||
| − | + | ||
| − | + | ||
| − | + | ||
| − | + | ||
| − | + | ||
<center> | <center> | ||
{| border="1" | {| border="1" | ||
| − | |||
| − | |||
| − | |||
| − | |||
| − | |||
|- | |- | ||
| − | | | + | | '''Compound ID''' |
| − | | | + | | '''Compound #''' |
| − | | | + | | '''SMILES''' |
| − | + | ||
| − | + | ||
|- | |- | ||
| − | | | + | | 43847864 |
| − | + | | 3 | |
| − | | | + | | CN(CCOC)C[C@@H]1CN(C[C@@H]1CO)CC2=CC3=CC=CC=C3C=C2 |
| − | | | + | |
| − | + | ||
| − | + | ||
|- | |- | ||
| − | | | + | | 30020341 |
| − | + | | 2 | |
| − | + | | CN(CCO)C[C@@H]1CN(C[C@@H]1CO)CC2=CC3=CC=CC=C3C=C2 | |
| − | + | ||
| − | | | + | |
| − | | | + | |
|- | |- | ||
| − | | | + | | 10351573 |
| − | ( | + | | 4 |
| − | | | + | | C1CC1[C@H]2CN(C[C@@H]2N)C(=O)C3=CN=C(N=C3)NC4=CC=CC=C4 |
| − | | | + | |- |
| − | | | + | | 86998996 |
| − | | | + | | 1 |
| + | | CCNC1=NC=C(C=N1)C2=CC(=NC(=C2C#N)N)C3=CC=CN3 | ||
|- | |- | ||
| − | |||
| − | |||
|} | |} | ||
</center> | </center> | ||
| − | + | ||
| + | '''These online resources may be helpful to learning more about the hits identified in the SMM:''' | ||
| + | *Cloud version of ChemDraw [https://chemdrawdirect.perkinelmer.cloud/js/sample/index.html here]. | ||
| + | **Copy and paste the small molecule smiles into the work space to get a chemical structure | ||
| + | *Platform to transform the smiles information into a PubChem ID [https://pubchem.ncbi.nlm.nih.gov/idexchange/idexchange.cgi here]. | ||
| + | **Copy and paste the smiles into the input ID search to determine the ID number. | ||
| + | *PubChem database of chemical information [https://pubchem.ncbi.nlm.nih.gov here]. | ||
| + | **Includes small molecule molecular weight and other useful information. | ||
<font color = #4a9152 >'''In your laboratory notebook,'''</font color> complete the following: | <font color = #4a9152 >'''In your laboratory notebook,'''</font color> complete the following: | ||
| − | * | + | *How many features did you identify that are present in two or more of the small molecules that putatively bind PF3D7_20109-F21? Are there more or less than you expected? |
| − | + | *Is there a feature present in all of the identified small molecules? What might this suggest about the binding site(s) and / or binding ability of PF3D7_20109-F21? | |
| − | + | *Can you assign the identified small molecules to sub-groups based on the common features that are present? | |
| − | + | *What might the different features represent? More specifically, consider whether each subgroup has a unique binding site on the target protein or if each subgroup represents different solutions for interacting with the same binding site. | |
| − | + | *How might you make modifications to the small molecules / features to probe binding? As a hint, consider how different functional groups could be positioned at a given site without altering qualitative binding in the SMM assay to translate that into some testable ideas (e.g. quantitative binding properties may be occurring that are functionally relevant, but not discernible by SMM assays; or such a site is not critical for binding and may allow for modifications that confer beneficial properties of the compound). | |
| − | + | ||
| − | + | ||
| − | + | ||
| − | + | ||
| − | + | ||
| − | + | ||
| − | + | ||
| − | + | ||
| − | + | ||
| − | + | ||
| − | + | ||
| − | + | ||
| − | + | ||
| − | + | ||
| − | + | ||
| − | + | ||
| − | + | ||
| − | + | ||
| − | + | ||
==Reagents list== | ==Reagents list== | ||
| − | * | + | *small-molecule microarray slides (a gift from Koehler Laboratory) |
| − | * | + | *Tris-HCl buffered saline (TBS): 50 mM Tris-Hcl (pH = 7.5), 150 mM NaCl (from BioRad) |
| − | + | *TBS containing 0.1% Tween20 (TBS-T) (from BioRad) | |
| − | *1% | + | *Alexa Fluor 647 anti-His antibody (from Qiagen) |
| − | + | ||
| − | + | ||
| − | * | + | |
| − | + | ||
==Navigation links== | ==Navigation links== | ||
| − | Next day: [[]]<br> | + | Next day: [[20.109(F21):M2D2 |Complete in silico cloning of protein expression plasmid]] <br> |
Previous day: [[20.109(F21):M1D7 | Analyze data using statistical methods]]<br> | Previous day: [[20.109(F21):M1D7 | Analyze data using statistical methods]]<br> | ||
Latest revision as of 20:00, 15 November 2021

Contents
Introduction
A small molecule microarray (SMM) requires the covalent attachment of a library of small molecules to a glass slide. Our library is meant to broadly sample the drug-like chemical space (i.e. all possible chemical structures that have drug-like physical properties) and contains about 50,000 small molecules. Some libraries are much smaller, while many pharmaceutical companies possess high-throughput screening (HTS) collections of millions of compounds. Because this chemical space is very large, it’s difficult to generalize any single chemical reaction for this attachment that can be applied to all small molecules. We take a “one-size-fits-most” approach, where the glass slide is functionalized with a broadly reactive electrophile capable of reacting with nucleophiles present in most drug-like small molecules, such as alcohols or amines. Many small molecules contain multiple nucleophiles suitable for attachment. In this case, our manufacturing will result in a mixture of attachment sites. It’s important to remember that attachment to the glass slide constrains the possible orientation of the protein-small molecule interaction; some orientations are not possible because the glass slide and linker are in the way.
We start with a glass slide with exposed amines across the surface and attach a short PEG (polyethylene glycol) linker. To the end of this PEG linker, an isocyanate group is attached. Isocyanate, or R-N=C=O, is a resonant structure, and a partial positive charge is stabilized on the carbon atom. This carbon atom is electrophilic, and small molecules with nucleophiles will react here. We estimate that about 70% of drug-like small molecules are amenable to this reaction, and our library is filtered to contain only these molecules.

Our compound library is dissolved in DMSO and stored in 384-well plates. To dispense the compounds onto our functionalized glass slide, a robotic arm with a set of 48 metal pins is used to transfer the compounds to the glass slide. Each metal pin has a small slit in the end, and capillary action is used to precisely withdraw and dispense consistent volumes. When the pins touch the glass slide, the compound in DMSO is dispensed into a small circle of approximately 160 micron in diameter. Each pin prints one compound in two different locations on each slide, and then the pins are washed in water and DMSO. This process is repeated for each compound, resulting in our final microarray. The microarray is divided into 48 subarrays, and each subarray corresponds to one pin and contains 256 discrete spots. Within each subarray, we print a set of fluorescent compounds in the shape of an ‘X’ so that we can precisely determine where each spot is printed. After the compounds react, we quench the surface so that no electrophiles remain. This results in our final microarray; a collection of approximately 12,000 discrete spots displaying one compound each.
(Written by Rob Wilson. For more information read Bradner, J. E., McPherson, O. M., and Koehler, A. N. (2006) A method for the covalent capture and screening of diverse small molecules in a microarray format. Nature Prot. 1:2344-2352. PMID: 17406478.)
Protocols
Part 1: Review SMM experimental details
For timing reasons, you will not perform an SMM experiment this semester. Instead you will expand on the results gathered by researchers in the Niles Laboratory to test putative small molecule binders in a secondary assay. To ensure that you are familiar with the steps used in an SMM screen, review the procedure below.
Perform SMM screen
To ensure the steps included below are clear, please watch the video tutorial linked here: [SMM Screen]. The steps are detailed below so you can follow along!
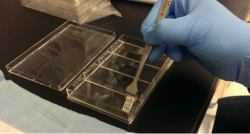
- Obtain two printed SMM slides from the front laboratory bench.
 Only use forceps at the barcoded end of the slide.
- Only hold them at the barcoded end as you would otherwise disrupt the ligands that are printed on the surface.
- Record the barcode numbers of your slides in your laboratory notebook.
- Carefully place each slide, barcode facing up, into a well of a 4-well chamber dish using the slide forceps.
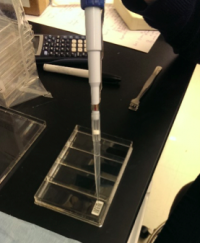 Add all liquid to the barcoded end of the slide.
- Again, only hold the slide at the barcoded end.
- Add 3 mL of your diluted protein solution to the chambers that contain your slides.
- Pipet the diluted protein solution onto the barcoded end of the slides.
- Avoid generating bubbles as you add your diluted protein solution.
- Gently rock the 4-well chamber dish back and forth until the slides are completely covered with the diluted protein solution.
- Cover the 4-well chamber dish with aluminum foil and incubate on the rocking table for 1 hr.
- During all incubations it is important to keep the slides covered as the fluorescein spots used for alignment during scanning are sensitive to light.
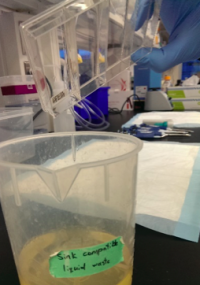 Pour liquid from the corner of the 4-well chamber dish.
- During all incubations it is important to keep the slides covered as the fluorescein spots used for alignment during scanning are sensitive to light.
- Carefully pour the diluted protein solution from your 4-well chamber dish into a waste container by tipping the dish such that the liquid leaves the dish from the corner.
- The surface tension should keep the slides in the 4-well chamber dish; however, it is good to be careful that they do not fall into the waste container.
- Add ~3 mL of TBS-T to the chambers that contain your slides.
- Remember, pipet the liquid onto the barcoded end of the slides.
- Don't 'push' the liquid across the surface of the slide with the pipet. Instead, gently rock the 4-well chamber dish back and forth to completely cover your slides.
- Incubate the slides on the rocking table for 2 min.
- Don't forget to cover the 4-well chamber dish with aluminum foil.
- Pour the TBS-T from the 4-well chamber dish as above into a waste container.
- Complete Steps #8 - 10 a total of 3 times.
- Move your slides to a fresh 4-well chamber dish to eliminate carryover from the protein and/or buffer solutions.
- Prepare 7 mL of anti-His antibody solution in TBS-T.
- Dilute the antibody stock 1:1000 at the front laboratory bench.
- Add 3 mL of the diluted antibody solution to the chambers that contain your slides.
- Pipet the diluted antibody solution onto the barcoded end of the slides.
- Avoid generating bubbles as you add your diluted antibody solution.
- Gently rock the 4-well chamber dish back and forth until the slides are completely covered with the diluted antibody solution.
- Cover the 4-well chamber dish with aluminum foil and incubate on the rocking table for 1 hr.
- Carefully pour the diluted antibody solution from your 4-well chamber dish into a waste container.
- Add ~3 mL of TBS (not TBS-T!) to remove excess detergent and incubate your covered 4-well chamber dish on the rocking table for 2 min, then pour liquid into a waste container.
- Lastly, wash the slides with dH2O.
- Obtain 2 reservoirs and add fresh dH2O to each.
- Label the reservoirs '1' and '2'.
- Wash each slide by removing it from the 4-well chamber dish with the slide forceps and dunking it 8 times into reservoir 1, then dunking it 8 times into reservoir 2.
- Dry your slides by carefully inserting your slides in the 'slide spinner' at the front laboratory bench.
- Be mindful not to scrape the face of your slides on the slide holder.
- Centrifuge your slides for 30 sec.
- Transfer your slides into fresh 50 mL conical tubes and wrap in aluminum foil.
- Store SMM slides at 4 °C until imaging.


Scan SMM slides
After the printed SMM slides are incubated with the purified PF3D7_20109-F21 protein, the next step is to check which of the small molecules, if any, you screened may be able to bind PF3D7_20109-F21. To do this the slides are imaged using a Genepix microarray scanner. The scanner measures the fluorescence signal emitted from the slide at two wavelengths: 532 nm and 635 nm. The goal for today is to familiarize you with how the SMM slides are scanned and imaged. These images are the raw data that will be used to identify putative small molecule binders.

When the SMM slides are imaged, the scanner exposes each slide to excitation light specific to the fluorophores used in the experiment. As shown in the figure above, two fluorophores were used to evaluate small molecule binding to PF2D7_20109-F21. The green spots represent locations on the SMM slide where fluorescein was printed. Fluorescein is a fluorescent dye that emits at 532 nm and is used for alignment purposes. Correct alignment is critical to knowing which small molecules are in which spots on the slide. Red spots are indicative of small molecules that are bound by PF3D7_20109-F21. The signal is due to an Alexa Fluor 647 anti-His antibody that emits at 635 nm.
During imaging, the scanner detects the intensity of the emitted fluorescence light to generate an image that can be analyzed. The intensity and position of the 'red' signal associated with putative small molecule binders is what will be assessed in the next laboratory session. This analysis will provide a list of 'hits' that can be used in future studies to identify drug candidates.
To ensure you are familiar with the steps involved in imaging the SMM experiment, please watch the video tutorial provided by a researcher from the Koehler Laboratory linked here: SMM Scanning. The steps are detailed below so you can follow along!
- Place the slide in the scanner barcode side down.
- Set the desired wavelengths that you want to scan.
- For fluorescein: 532 nm
- For Alexa Fluor 647: 635 nm
- Set the wavelength, filter, PMT, and power settings.
- Run a preview scan to optimize the PMT for the 635 nm (red) emission.
- Complete a full scan using the optimal PMT value.
- Following the scan, you will see an image of your slide as below.
In your laboratory notebook, complete the following:
- What color is emitted by fluorescein? What does this indicate on the scan (what is present in spots that emit this signal)?
- What color is emitted by Alexa Fluor 647? What does this indicate on the scan (what is present in spots that emit this signal)?

Analyze SMM images

The robust z-score differentiates signal from noise by providing a value that represents the intensity of a signal above background. In the case of the SMM experiment, the intensity of a fluorescent signal above the background fluorescence is calculated. To do this the fluorescence emitted across the entire slide is grouped to define the Median Absolute Deviation (MAD), which is is a measure of the variability of a univariate dataset. Though beyond the scope of this class, the equation for calculating the robust z-score assigns a value for how much more intense the fluroescent signal at a spot is over background. The higher the value, the more different the signal from background.
After putative binders are identified via the robust z-score, the data are examined by-eye using the criteria discussed in the prelab. Please review the prelab notes for how this process is completed.
In your laboratory notebook, complete the following:
- Why is it important to complete a by-eye inspection of the SMM results?
Part 2: Visually evaluate chemical structures of putative binders
One method for assessing protein-small molecule binding is to visually inspect known small molecule binders for common features / structures. Your goal for today is to carefully examine the hits identified by the class and identify any common features / structures. As in the image below, it is possible that multiple features will be present within the same small molecule.

With your partner, review the hits that were identified in the SMM screen completed for PF3D7_20109-F21 (see table below). To see the chemical structures, translate the SMILES strings using one of the methods described in the text below the table. It may be easier to copy / paste the small molecule images into a powerpoint file so you can readily see all of the structures. Also, it may be helpful to use a color-coding system (like the one in the image provided above) to highlight features / structures that are common to the small molecules that putatively bind PF3D7_20109-F21.
| Compound ID | Compound # | SMILES |
| 43847864 | 3 | CN(CCOC)C[C@@H]1CN(C[C@@H]1CO)CC2=CC3=CC=CC=C3C=C2 |
| 30020341 | 2 | CN(CCO)C[C@@H]1CN(C[C@@H]1CO)CC2=CC3=CC=CC=C3C=C2 |
| 10351573 | 4 | C1CC1[C@H]2CN(C[C@@H]2N)C(=O)C3=CN=C(N=C3)NC4=CC=CC=C4 |
| 86998996 | 1 | CCNC1=NC=C(C=N1)C2=CC(=NC(=C2C#N)N)C3=CC=CN3 |
These online resources may be helpful to learning more about the hits identified in the SMM:
- Cloud version of ChemDraw here.
- Copy and paste the small molecule smiles into the work space to get a chemical structure
- Platform to transform the smiles information into a PubChem ID here.
- Copy and paste the smiles into the input ID search to determine the ID number.
- PubChem database of chemical information here.
- Includes small molecule molecular weight and other useful information.
In your laboratory notebook, complete the following:
- How many features did you identify that are present in two or more of the small molecules that putatively bind PF3D7_20109-F21? Are there more or less than you expected?
- Is there a feature present in all of the identified small molecules? What might this suggest about the binding site(s) and / or binding ability of PF3D7_20109-F21?
- Can you assign the identified small molecules to sub-groups based on the common features that are present?
- What might the different features represent? More specifically, consider whether each subgroup has a unique binding site on the target protein or if each subgroup represents different solutions for interacting with the same binding site.
- How might you make modifications to the small molecules / features to probe binding? As a hint, consider how different functional groups could be positioned at a given site without altering qualitative binding in the SMM assay to translate that into some testable ideas (e.g. quantitative binding properties may be occurring that are functionally relevant, but not discernible by SMM assays; or such a site is not critical for binding and may allow for modifications that confer beneficial properties of the compound).
Reagents list
- small-molecule microarray slides (a gift from Koehler Laboratory)
- Tris-HCl buffered saline (TBS): 50 mM Tris-Hcl (pH = 7.5), 150 mM NaCl (from BioRad)
- TBS containing 0.1% Tween20 (TBS-T) (from BioRad)
- Alexa Fluor 647 anti-His antibody (from Qiagen)
Next day: Complete in silico cloning of protein expression plasmid