Difference between revisions of "20.109(F20):M2D5"
Noreen Lyell (Talk | contribs) (→Introduction) |
Noreen Lyell (Talk | contribs) (→Introduction) |
||
| Line 5: | Line 5: | ||
==Introduction== | ==Introduction== | ||
| − | In the previous laboratory session the printed SMM slides were incubated with the purified PF3D7_1351100 protein in an effort to identify putative small molecule binders. To check which of the small molecules, if any, you screened may be able to bind PF3D7_1351100, the slides were imaged using a Genepix microarray scanner. The scanner measured the fluorescence signal emitted from the slide at two wavelengths | + | In the previous laboratory session the printed SMM slides were incubated with the purified PF3D7_1351100 protein in an effort to identify putative small molecule binders. To check which of the small molecules, if any, you screened may be able to bind PF3D7_1351100, the slides were imaged using a Genepix microarray scanner. The scanner measured the fluorescence signal emitted from the slide at two wavelengths: 532 nm |
and 635 nm. The goal for today is to familiarize you with how the SMM slides are scanned and imaged. These images are the raw data that will be used to identify putative small molecule binders. | and 635 nm. The goal for today is to familiarize you with how the SMM slides are scanned and imaged. These images are the raw data that will be used to identify putative small molecule binders. | ||
Revision as of 13:49, 23 July 2020
Contents
Introduction
In the previous laboratory session the printed SMM slides were incubated with the purified PF3D7_1351100 protein in an effort to identify putative small molecule binders. To check which of the small molecules, if any, you screened may be able to bind PF3D7_1351100, the slides were imaged using a Genepix microarray scanner. The scanner measured the fluorescence signal emitted from the slide at two wavelengths: 532 nm and 635 nm. The goal for today is to familiarize you with how the SMM slides are scanned and imaged. These images are the raw data that will be used to identify putative small molecule binders.

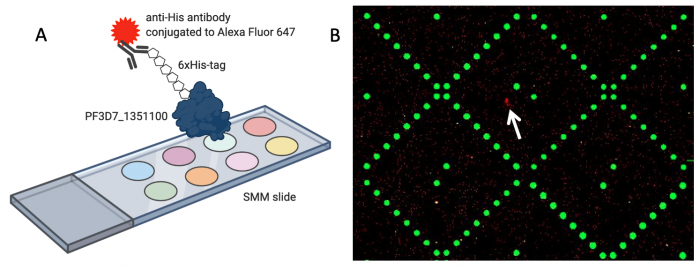
When the SMM slides are imaged, the scanner exposes each slide to excitation light specific to the fluorophores used in the experiment. As shown in the figure above, two fluorophores were used to evaluate small molecule binding to PF2D7_1351100. The green spots represent locations on the SMM slide where fluorescein was printed. Fluorescein is a fluorescent dye that emits at 532 nm and is used for alignment purposes. Correct alignment is critical to knowing which small molecules are in which spots on the slide. Red spots are indicative of small molecules that are bound by PF3D7_1351100. The signal is due to an Alexa Fluor 647 anti-His antibody that emits at 635 nm.
During imaging, the scanner detects the intensity of the emitted fluorescence light to generate an image that can be analyzed. The intensity and position of the 'red' signal associated with putative small molecule binders is what will be assessed in the next laboratory session. This analysis will provide a list of 'hits' that can be used in future studies to identify drug candidates.
Protocols
Part 1: Scan SMM slides
To ensure you are familiar with the steps involved in imaging the SMM experiment, please watch the video tutorial provided by a researcher from the Koehler Laboratory (linked [[ | here]]). The steps are detailed below so you can follow along!
- Place the slide in the scanner barcode side down.
- Set the desired wavelengths that you want to scan.
- For fluorescein: 532 nm
- For Alexa Fluor 647: 635 nm
- Set the wavelength, filter, PMT, and power settings.
- Run a preview scan to optimize the PMT for the 635 nm (red) emission.
- Complete a full scan using the optimal PMT value.
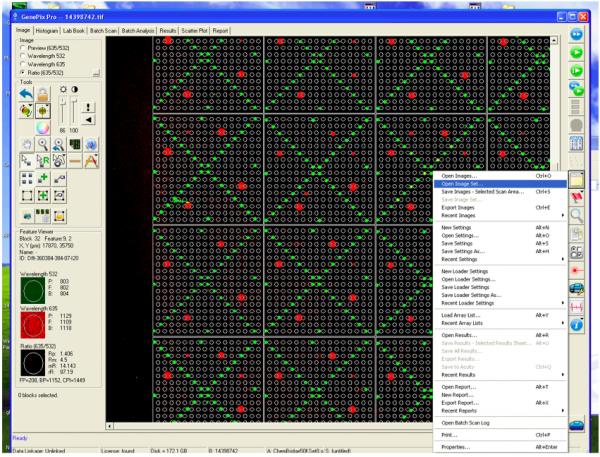
- Following the scan, you will see an image of your slide as below.
In your laboratory notebook, complete the following:
- What color is emitted by fluorescein? What does this indicate on the scan (what is present in spots that emit this signal)?
- What color is emitted by Alexa Fluor 647? What does this indicate on the scan (what is present in spots that emit this signal)?
Part 2: Review journal article
Skim and discuss the following journal article with your laboratory partner:
Chen et al. "Small molecule microarrays enable the discovery of compounds that bind the Alzheimer's αβ peptide." Journal of the American Chemical Society. (2010) 47:17015-17022.
The initial experiment presented within this publication was an SMM screen that identified small molecule binders of the αβ petptide. This first step is very similar to what you completed in this module! To further assess the results of the SMM, Chen et al. completed several follow-up experiments.
In your laboratory notebook, complete the following with your partner:
- List the experiments that were reported by the researchers and the conclusions of these experiments. You do not need to provide much detail here, just a sentence or two with what was done and what information/insight was gained.
- Consider how these experiments are connected such that the paper provides a complete and coherent story. What is the story?
In your laboratory notebook, complete the following individually:
- Use this list generated with your partner as a guide to organize the data that you will include in your Research article. To get you started, create an outline that orders the figures that will be included in the assignment and record your thoughts on how the figures relate to each other (ie what is your story and how do the data support your story?).
- Think about follow-up experiments that would be useful / insightful if you were to assess the putative binders identified in the SMM screen for PF3D7_1351100. How might you introduce / organize the follow-up experiments in the Discussion section of your Research article?
- For ideas on future works you can consider the follow-up experiments completed by Chen et at.; however, keep in mind that not all of the approaches in the paper are relevant to your research! The questions that you address in your future works experiments should work toward a complete and coherent story.
Reagents
- Genepix 4300 microarray scanner (Molecular Devices)
- Genepix Pro software (Molecular Devices)
Next day: Analyze SMM data to confirm putative small molecule binders

