20.109(F20):M1D6

Contents
Introduction
In this module we used two methods to assess DNA damage and repair in response to treatment with H2O2 +/- As: the γH2AX assay and the CometChip assay.

The core BER pathway includes only four proteins that function to remove the damaged base and replace it with the correct base. First, a DNA glycosylase recognizes that a damaged base is present in the DNA and cleaves an N-glycosidic bond, which creates an apurinic or apyrimidinic site (referred to as an AP site in both cases). Different DNA glycosylases recognize different types of base lesions. Second, the DNA backbone is cleaved to create a single-strand DNA nick by either a DNA AP endonuclease or a DNA AP lyase. Next, a DNA polymerase incorporates the correct base using the sister strand as a template. Last, a DNA ligase completes the repair by sealing the single-strand nick, which restores integrity to the helix. It is important to recognize that the oxidative damage caused by H2O2 does not generate DNA strand breaks, instead the BER pathways generates single-strand breaks as part of the repair process! Exposure to As potentially exacerbates this by inhibiting the ligation step that is crucial in the final step of the BER pathway.
So how does the biology fit into the experiments used to assess DNA damage and repair in response to treatment with H2O2 +/- As?
In the γH2AX assay, DNA double-strand breaks are visualized using immunofluoresence microscopy. When a DNA double-strand break is introduced into the DNA, the H2AX histones near the break are phosphorylated. Upon phosphorylation H2AX is referred to as gamma-H2AX. Given that only H2AX histones near the site of DNA damage are phosphorylated, γH2AX is a useful target when determining the abundance and location of double-strand breaks. Remember that the DNA damage expected to occur in response to H2O2 is single-stranded breaks. The logic for performing the γH2AX experiment is that multiple single-stranded breaks that are not repaired will lead to double-stranded breaks.
The CometChip is a method that allows for the direct measurement of single-strand breaks. In this assay are treated, loaded into the CometChip, then lysed to release the DNA into the microwell. Following cell lysis, the CometChip is incubated in an alkaline buffer that unwinds the DNA. This step allows for all types of DNA damage to be detected. Lastly, gel electrophoresis is used to separate the DNA fragments. DNA fragments migrate away from the microwell and generate a comet tail that is a measure of the extent of DNA damage.
One final aspect of our experiments that is important to interpreting the results is that we measured DNA damage over time so that repair could be assessed. The level of DNA damage was measured over a timecourse in both assays that were used. By determining the amount of DNA damage that persisted over time after the H2O2 +/- As treatment, it is possible to make inferences regarding the extent of repair that occurred in the treated cells.
Protocols
Part 1: Image CometChip experiment
To ensure you are familiar with the steps involved in imaging the CometChip experiment, please watch the video tutorial (linked [[ | here]]).
Part 2: Analyze CometChip images
First, download the CometChip images from the DROPBOX. Create (or copy and paste) the folder of your team images into the Documents\MATLAB\CometChip Analysis directory of the lab computer.
You will complete the following processes twice (stack images, optimize analysis parameters, measure tail lengths, export to Excel)--once for each CometChip. You should end up with one Excel file for each chip.
Stack images using ImageJ
- The script you will run will combine images from the same well into a stacked image and rename the files for the subsequent Matlab script to recognize them.
- Open ImageJ from Applications.
- Go to Plugins → Macros → Run...
- Select script "GenImageStacks_singleimage.txt" within the Documents\MATLAB\CometChip Analysis directory
- Choose the appropriate source directory that contains your image files.
- Find in Documents\MATLAB\CometChip Analysis directory
- Create a destination directory by selecting New Folder and naming the folder appropriately (eg. "180927M059_H2O2_stacked").
- Click Choose.
- ImageJ will create the stacked images in ~2 min.
- Please do not hit any additional keys until this process is completed.
- Confirm that the stacks are in the destination directory.
- Open the directory you just created, containing your stacked images.
- You should see one .tif image stack per well.
- Close ImageJ.
Optimize analysis parameters using MATLAB
- Open MATLAB from Applications.
- Be sure that "CometChip Analysis" is the current folder (double click on the "CometChip Analysis" folder from within the "Current Folder" window).
- In the command window, type in "guicometanalyzer" press enter to run the script.
- In the MultiWell Comet Analyzer window:
- Check that the Pixel Calibration value is 1.61.
- Check that the Image Rotation value is 0 if your tails are to the right. Image Rotation should be 180 if your tails are going to the left.
- Check that the Array Spacing (μm) is 240.
- Check that the Head Diameter value is 20.
- Confirm the settings with the image below.
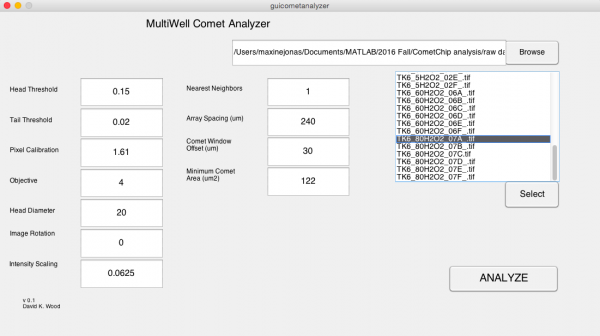 Multiwell Comet Analyzer window.
- Click Browse.
- Select the stacked image directory you created in the previous section.
- Click Open.
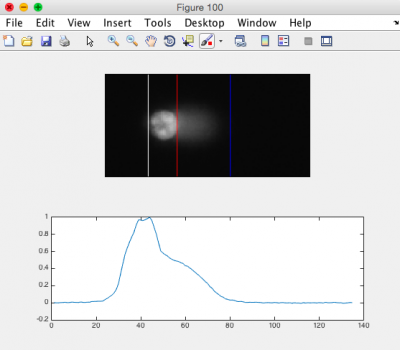 CometChip analysis showing differentiation between head and tail.
- From the image stack files loaded to the MultiWell Comet Analyzer window, choose ONE image that is expected to show DNA damage. You are just using this image to optimize the analysis parameters.
- The chosen file should be highlighted.
- Click Select.
- Click Analyze.
- Click "Yes" when the dialog box appears and asks if you want to run the program in "debug mode."
- Please do not hit any additional keys until this process is completed.
- In the MATLAB command window you will see the number of comets to be analyzed. The same number of figures should be generated.
- Review the generated images.
- Ensure that the head of the comet is bracketed by a white line on the left, and a red line on the right. The tail should be bracketed by the red line and a blue line on the right. See the image to the right for an example.
- You may need to adjust the "Tail Threshold" value so that the tail is identified appropriately and/or the "Head Threshold" value so that the head is identified appropriately.
- Note: it is okay if some of the images do not appear correct according to the above criteria; however, the majority of your images should be correct.
- In the Command Window type "close all."
- If you need to adjust your parameters, repeat this process again until you find the optimal parameters for your analysis.
- Find the guicometanalzyer window.
- Adjust parameters as needed and repeat steps above by continuing to run in "debug mode."
- Type "close all" when done, but leave Matlab open.


Measure head and tail lengths using MATLAB
- Find the guicometanalyzer window
- If it has disappeared, run the script again by typing "guicometanalyzer" in the command window.
- In the MultiWell Comet Analyzer window, confirm the parameters as above.
- Click Browse.
- Select the stacked image directory you created with ImageJ.
- Click Open.
- Highlight all stack files in the MultiWell Comet Analyzer window.
- Click Select.
- Click Analyze.
- Click "No" when the dialog box appears and asks if you want to run the program in "debug mode."
- Confirm that there is a .txt file for each stack in your folder.
- Be sure to keep MATLAB open.
Compile results and export to Excel
- In the command window, type "comettoexcel" and press enter to run the script.
- When prompted, select the directory containing all the txt files that were output by guicometanalyzer and click "Open."
- The script will compile all your data, calculate the median values for each well, and export the data in an Excel file.
- Next, a dialog box will prompt you to save the Excel file.
- Please choose an appropriate directory and file name to save your data.
- Click "Save" and ensure your data has saved correctly.
- Post your final Excel spreadsheets on the Class data page.
Part 3: Draft Data summary slide for γH2AX results
To get a headstart and further feedback from the Instructors, you will draft the slide that will present the γH2AX data for your Data summary today in class. With your partner, use the template below, the Instructor comments from your M1D5 homework assignments, and the helpful hints from the Comm Lab workshop to craft a data slide with the required elements.
Individually you and your laboratory partner each crafted figures (with a title and caption) and wrote corresponding results text using the γH2AX data. In this exercise you will come together to decide how to best present these data for the Data summary!

Next day: Complete data analysis using statistical methods