20.109(S17):Examine quantitative PCR results (Day9)

Contents
Introduction
Today is the final laboratory session for Module 2! You have completed all of the bench work for your research; however, there is still data analysis to complete for the cell viability assay and the qPCR experiment. In addition to plotting and normalizing the data, you will complete statistical analysis to determine the significance of your results.
Statistics are mathematical tools used to analyze, interpret, and organize data. The specific tools that you will use are confidence intervals (CI) and the Student's t-test. To begin, review the following definitions:
- Mean (or average) is defined as:

- With infinite data, the mean (χι) approaches the true mean (μ).
- Standard deviation measures the variation in the data and is defined as:

- With infinite data, the standard deviation (s) approaches the true standard deviation (σ).
Because standard deviation is only justified when sufficient data have been collected to generate a normal curve, you will use confidence intervals to report the likelihood that your results predict the true mean. A confidence interval is a defined interval that is calculated to define the true mean to a specified level of confidence. Simply, it is possible to define a range in your data set that likely contains the true mean based on the calculated mean.
- Confidence interval is defined as:

In your data, you should use the CI to generate error bars due the low n. Be sure to report which confidence level was used to calculate the intervals reported. So, what does this all mean in regard to the data you will report? As an example, if the calculated χι of a data set equals 80 au there is a 95% chance the μ is between 50 au and 110 au, where au = arbitrary units. And how does this relate to s? If you know the μ, the σ represents a 68% confidence interval.
Lastly, you will use Student's t test to report if your data are statistically different between treatments.
- Student's t test is defined as:

The value you calculate with the Student's t test equation is referred to as tcalculated. This tcalculated value is compared to the ttabulated value in the the t table, according to the appropriate n - 1 using the p-value for the two-tailed distribution (which assumes that you do not know how the data will shift). If the tcalculated value is greater than the ttabulated, then the data sets are significantly different at the specific p-value. So, what does this all mean in regard to the data you will report? As an example, if the tcalculated for a data set with n - 1 = 10 is 3 (given that the ttabulated is 2.228), then the data sets are different with a p-value ≤ 0.05. Which means that there is less that a 5% chance that the data sets are the same.
Protocols
Part 1: Practice statistical analysis
Review these data from an experiment where cells were exposed to increasing amounts of radiation. Your goal is to determine if a statistically significant amount of DNA damage was induced. For the purpose of this exercise, the values in the spreadsheet are in arbitrary units of 'DNA damage', where the higher numbers indicate more damage.
When interpreting the statistics, consider how you may use the information to convince someone that the DNA damage was significant. You may find this spreadsheet, originally created by Prof. Bevin Engelward and modified by the 20.109 staff, helpful for this exercise. At a minimum, you should post a bar plot of the data with 95% confidence intervals and indicate if there is a statistically significant difference (i.e. provide a p-value) between conditions in your Benchling notebook.
Part 2: Analyze quantitative PCR data
As discussed in prelab, the qPCR experiment with your samples was not successful. This is likely due to degraded RNA, which is a very common issue given the prevalence, abundance, and stability of RNases. You will therefore use the data collected by the teaching faculty for this exercise and in your M2 Research Article.
Before you can apply the statistical tools from Part 1 to your data, you must first normalize the p21 expression levels. To account for any unintended biases in RNA purification and / or cDNA preparation, it is important to normalize the expression of the transcript of interest to expression of a housekeeping or constitutive gene. Ideally, the gene to which the data of interest are normalized is not responsive to the treatment tested. In our experiment, we used GAPDH because it is not expected to be responsive to etoposide treatment. How might you confirm this assumption?
- Review the data in this spreadsheet.
- The DLD-1 and BRCA2- RNA isolated from untreated and etoposide treated cells was probed using both the p21 and GAPDH primers.
- Each reaction was completed in triplicate. Note: these are technical replicates.
- The data are represented as the 'threshold cycle' CT or amplification cycle at which SYBR Green fluorescent signal was detected (review M2D4 Introduction).
- Normalize p21 expression to GAPDH expression (ΔCT).
- Subtract the GAPDH CT value from the p21 CT value using the appropriate treatment conditions, according to the screenshot below.
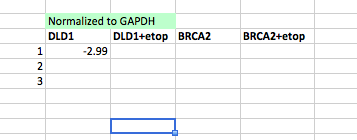

- Subtract the GAPDH CT value from the p21 CT value using the appropriate treatment conditions, according to the screenshot below.
- Exponentially transform each normalized value to the ΔCT expression.
- ΔCT expression = 2-ΔCT.
- Average the replicates for each treatment, then calculate the 95% CI and t-test p-value.
- With this information, graph your data with error bars and include information concerning any statistical significance.
- Are these results consistent with those from the RNA-seq data?
- Load the data:
load("~/Desktop/RNA-seq data analysis/preprocessed_data.RData")- library("DESeq2")
- Plot the reads for p21 (also called CDKN1A):
plotCounts(dds,"CDKN1A", intgroup="group")
- Load the data:

Part 3: Analyze cell viability assay data
Review your cell viability results from M2D4 (posted to the Discussion tab of the M2 main page). Use the statistical tools you learned in the above exercises to analyze the pooled class data for your M2 Research Article.
Next day: First day of M3
Previous day: Journal club II