20.109(S21):M3D2
From Course Wiki
Revision as of 15:06, 19 April 2021 by Noreen Lyell (Talk | contribs)
Introduction
Protocols
Part 4: Evaluate purified IPC
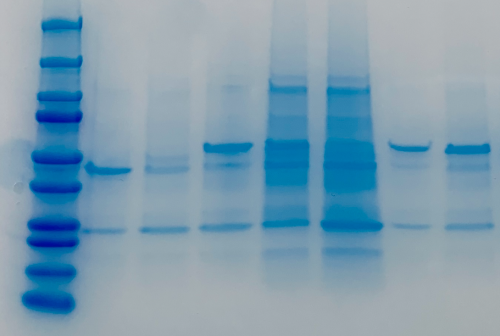
To evaluate the purified IPC protein, we will use the same methods as when we assessed purified TDP43-RRM12: SDS-PAGE and microBCA (this is a variation of the BCA procedure that is used to measure lower protein concentrations). To review these methods, look back at the information provided on M2D2!
Assess purity using SDS-PAGE
Measure concentration using microBCA
- calculate concentration of total protein in each sample...
- using SDS-PAGE to estimate percentage of total protein that is IPC...
- might adding different amounts of IPC variants complicate comparisons... how... (move to next day)
- how could you change experiment such that same amounts of IPC used... (move to next day)
Part 2: Advance preparation for SDS-PAGE of protein extracts
- Last time you measured the amount of cells in each of your samples (-IPTG and +IPTG of the wild-type IPC and one correct mutant). (If you ran cultures overnight, the teaching faculty measured the +IPTG samples for you and posted the results.) Look back at your measurements, and find the sample with the lowest cell concentration. Set aside 15 μL of this sample for PAGE analysis in an eppendorf.
- For your other three samples, you should take the amount of bacterial lysate corresponding to the same number of cells as the lowest concentration sample. For example, if the OD600 of your WT -IPTG sample was 0.05, and the OD600 of your WT +IPTG sample was 0.30, you would take 15 μL of the -IPTG, but only 2.5 μL of the +IPTG sample.
- Next, add enough water so the each sample has 15 μL of liquid in it. You might use the table below to guide your work.
- Finally, add 3 μL of 6X sample buffer to 15 μL of each of your diluted lysates. These will be stored in the freezer until next time.
| Sample Name | OD600 | Sample Volume (μL) | Water Volume (μL) | Total Volume (μL) |
|---|---|---|---|---|
| -IPTG WT | 15 | |||
| +IPTG WT | 15 | |||
| -IPTG mutant | 15 | |||
| +IPTG mutant | 15 |
Part 4: Protein concentration
Part 4A: Prepare diluted albumin (BSA) standards
- Obtain a 0.25 mL aliquot of 2.0 mg/mL albumin standard stock and a conical tube of diH2O from the front bench.
- Prepare your standards according to the table below using dH2O as the diluent:
- Be sure to use 5 mL polystyrene tubes found on the instructors bench when preparing your standards as the volumes are too large for the microcentrifuge tubes.
| Vial |
Volume of diluent (mL) | Volume (mL) and source of BSA (vial) | Final BSA concentration (μg/mL) |
|---|---|---|---|
| A | 2.25 | 0.25 of stock | 200 |
| B | 3.6 | 0.4 of A | 20 |
| C | 2.0 | 2.0 of B | 10 |
| D | 2.0 | 2.0 of C | 5 |
| E | 2.0 | 2.0 of D | 2.5 |
| F | 2.4 | 1.6 of E | 1 |
| G | 2.0 | 2.0 of F | 0.5 |
| H | 4.0 | 0 | Blank |
Part 4B: Prepare Working Reagent (WR) and measuring protein concentration
- Use the following formula to calculate the volume of WR required: (# of standards + # unknowns) * 1.1 = total volume of WR (in mL).
- Prepare the calculated volume of WR by mixing the Micro BCA Reagent MA, Reagent MB, and Reagent MC such that 50% of the total volume is MA, 48% is MB, and 2% is MC.
- For example, if your calculated total volume of WR is 100 mL, then mix 50 mL of MA, 48 mL of MB, and 2 mL of MC.
- Prepare your WR in a 15 mL conical tube.
- Pipet 0.5 mL of each standard prepared in Part 4A into clearly labeled 1.5 mL microcentrifuge tubes.
- Prepare your protein samples by adding 990 μL of dH2O to your 10 μL aliquot of purified protein, for a final volume of 1 mL in clearly labeled 1.5 mL microcentrifuge tubes.
- Add 0.5 mL of the WR to each 0.5 mL aliquot of the standard and to your 0.5 mL protein samples.
- Cap your tubes and incubate at 60°C in the water bath for 1 hour. During this time download the sample data on the Discussion page to practice estimating protein concentration of your samples.
- Following the incubation, the teaching faculty will use the spectrophotometer to measure the protein concentrations of your standards and your purified samples.
- The cuvette filled only with water (H) will be used as a blank in the spectrophotometer.
- The absorbance at 562 nm for each solution will be measured and the results will be posted to today's Discussion page.
- Establish your standard curve by plotting OD562 for each BSA standard (B-H) vs. its concentration in μg/mL.
- Use the standard curve in its linear range (0.5 - 20 μg/mL), and its linear regression in Excel, to determine the protein concentration of each unknown sample (wild-type and mutant IPC).
Reagents list
- Luria-Bertani broth (LB) (from Difco)
- ampicillin; stock = 100 mg/mL (from Sigma)
- chloramphenicol; stock = 34 mg/mL (from Sigma)
- isopropyl β-d-1-thiogalactopyranoside (IPTG) (from Sigma)
- BugBuster Protein Extraction Reagent (from EMD Millipore)
- 6X Laemmli sample buffer (from Boston BioProducts)
- 4-20% polyacrylamide gels in Tris-HCl (from Bio-Rad)
- TGS buffer: 5 mM Tris, 192 mM glycine, 0.1% (w/v) SDS (pH 8.3) (from Bio-Rad)
- Precision Plus Dual Color Standard ladder (from Bio-Rad)
- Molecular weights of ladder bands (linked here).
- BioSafe Coomassie G-250 Stain (from Bio-Rad)
- Protein purification supplies (from Novagen/Calbiochem):
- Ni-NTA His-Bind Resin
- 1X Ni-NTA Bind Buffer; 50 mM NaH2PO4, pH 8.0; 300 mM NaCl; 10 mM imidazole
- 1X Ni-NTA Wash Buffer; 50 mM NaH2PO4, pH 8.0; 300 mM NaCl; 20 mM imidazole
- 1X Ni-NTA Elute Buffer; 50 mM NaH2PO4, pH 8.0; 300 mM NaCl; 250 mM imidazole
- Zeba Desalt Spin Columns (from Thermo Scientific)
- Micro BCA Protein Assay Kit (from Thermo Scientific)
Next day: Evaluate effect of mutations on IPC variants

