20.109(F19):Image CometChip (Day6)

Contents
Introduction
The goal for today is to get you started on the Data summary! To assist you in the preparation of your first major assignment, we will review the main concepts covered in this module. Remember, DNA damage is defined as any change in the chemical structure of the molecule, including breaks in the backbone, missing basepairs, and altered basepairs. Damaged DNA does not mean mutated DNA! Though both instances relay that the DNA has been changed, a mutation is defined as a change in the sequence.
Methyl methanesulfonate (MMS) is an alkylating agent
Exposure to alkylating agents occurs via the environment, food, and even cancer chemotherapeutic treatments. Alkylation is the transfer of an alkyl group from one molecule to another. In the context of DNA damage, most alkylating agents methylate DNA forming adducts at the N- and O- atoms in the bases. This change in the DNA results in double-strand breaks.
Base excision repair (BER) pathway repairs damaged bases

The core BER pathway includes only four proteins that function to remove the damaged base and replace it with the correct base. First, a DNA glycosylase recognizes that a damaged base is present in the DNA and cleaves an N-glycosidic bond, which creates an apurinic or apyrimidinic site (referred to as an AP site in both cases). Different DNA glycosylases recognize different types of base lesions. Second, the DNA backbone is cleaved to create a single-strand DNA nick by either a DNA AP endonuclease or a DNA AP lyase. Next, a DNA polymerase incorporates the correct base using the sister strand as a template. Last, a DNA ligase completes the repair by sealing the single-strand nick, which restores integrity to the helix. For a more detailed description of the BER pathway, read this review by Robertson et al.
Arsenite (As) inhibits ligase activity
As mentioned above, the final step in BER is a ligation reaction that seals the helix. Arsenite has been shown to enhance the genotoxicity of several mutagens and inhibit ligase activity. Thus, the experiments in this module are designed to test the combined effects of exposure to MMS, a DNA damaging agent, and As, a chemical known to decrease DNA repair capacity by inhibiting strand ligation.
Protocols
Part 1: Communication Lab workshop
Our communication instructors, Dr. Sean Clarke and Dr. Prerna Bhargava, will join us today for a discussion on designing effective figures and captions.
Part 2: Modify Figure / Caption homework
Use the information provided by your Instructor to edit your Figure / Caption homework assignment. Also, the teaching faculty will meet with each team to provide specific feedback and comments during class.
You can submit the updated version of the assignment by 10 pm tonight for grading.
Part 3: Process microscopy images for DNA damage experiment
For timing reasons, the teaching faculty imaged your CometChip for the DNA damage experiment. To ensure you understand the process you will see a demonstration of the process during laboratory today.
To analyze your DNA damage experiment results, download your CometChip images from the Class data tab or obtain images from an instructor. Create (or copy and paste) the folder of your team images into the Documents\MATLAB\CometChip Analysis directory of the lab computer.
You will complete the following processes twice (stack images, optimize analysis parameters, measure tail lengths, export to Excel)--once for each CometChip. You should end up with one Excel file for each chip.
Stack images using ImageJ
- The script you will run will combine images from the same well into a stacked image and rename the files for the subsequent Matlab script to recognize them.
- Open ImageJ from Applications.
- Go to Plugins → Macros → Run...
- Select script "GenImageStacks_singleimage.txt" within the Documents\MATLAB\CometChip Analysis directory
- Choose the appropriate source directory that contains your image files.
- Find in Documents\MATLAB\CometChip Analysis directory
- Create a destination directory by selecting New Folder and naming the folder appropriately (eg. "180927M059_H2O2_stacked").
- Click Choose.
- ImageJ will create the stacked images in ~2 min.
- Please do not hit any additional keys until this process is completed.
- Confirm that the stacks are in the destination directory.
- Open the directory you just created, containing your stacked images.
- You should see one .tif image stack per well.
- Close ImageJ.
Optimize analysis parameters using MATLAB
- Open MATLAB from Applications.
- Be sure that "CometChip Analysis" is the current folder (double click on the "CometChip Analysis" folder from within the "Current Folder" window).
- In the command window, type in "guicometanalyzer" press enter to run the script.
- In the MultiWell Comet Analyzer window:
- Check that the Pixel Calibration value is 1.61.
- Check that the Image Rotation value is 0 if your tails are to the right. Image Rotation should be 180 if your tails are going to the left.
- Check that the Array Spacing (μm) is 240.
- Check that the Head Diameter value is 20.
- Confirm the settings with the image below.
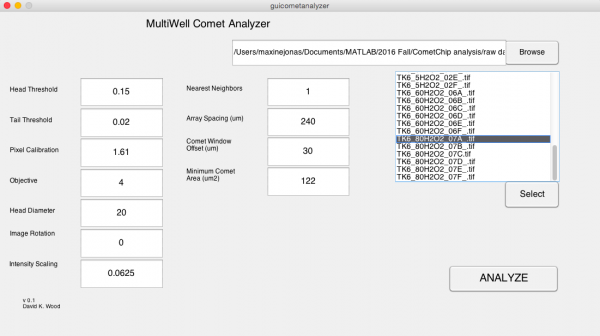 Multiwell Comet Analyzer window.
- Click Browse.
- Select the stacked image directory you created in the previous section.
- Click Open.
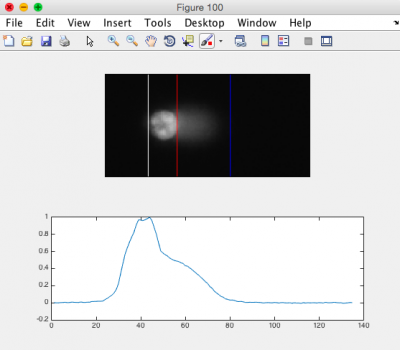 CometChip analysis showing differentiation between head and tail.
- From the image stack files loaded to the MultiWell Comet Analyzer window, choose ONE image that is expected to show DNA damage. You are just using this image to optimize the analysis parameters.
- The chosen file should be highlighted.
- Click Select.
- Click Analyze.
- Click "Yes" when the dialog box appears and asks if you want to run the program in "debug mode."
- Please do not hit any additional keys until this process is completed.
- In the MATLAB command window you will see the number of comets to be analyzed. The same number of figures should be generated.
- Review the generated images.
- Ensure that the head of the comet is bracketed by a white line on the left, and a red line on the right. The tail should be bracketed by the red line and a blue line on the right. See the image to the right for an example.
- You may need to adjust the "Tail Threshold" value so that the tail is identified appropriately and/or the "Head Threshold" value so that the head is identified appropriately.
- Note: it is okay if some of the images do not appear correct according to the above criteria; however, the majority of your images should be correct.
- In the Command Window type "close all."
- If you need to adjust your parameters, repeat this process again until you find the optimal parameters for your analysis.
- Find the guicometanalzyer window.
- Adjust parameters as needed and repeat steps above by continuing to run in "debug mode."
- Type "close all" when done, but leave Matlab open.


Measure head and tail lengths using Trevagen analysis software
- You will be taken to the Engelward microscope to analyze your comet chip data using the Trevagen analysis software. Please examine the resulting spreadsheets and upload your team data in the provided template. CometChip Data Template
Part 4: Group paper discussion
To better understand the structure and content for written communications in science, we will discuss the following research article:
Weingeist, D. M., et al. Single-cell microarray enables high-throughput evaulation of DNA double-strand breaks and DNA repair inhibitors. (2013) Cell Cycle. 126:907-915.
Our paper discussion will be guided by all that you have learned about how to write a cohesive story that clearly reports the data and provides strong support for the conclusions made about the data. During the paper discussion, everyone is expected to participate - either by volunteering or by being called upon!
Introduction
Remember the key components of an introduction:
- What is the big picture?
- Is the importance of this research clear?
- Are you provided with the information you need to understand the research?
- Do the authors include a preview of the key results?
Results
Carefully examine the figures. First, read the captions and use the information to 'interpret' the data presented within the image. Second, read the text within the results section that describes the figure.
- Do you agree with the conclusion(s) reached by the authors?
- What controls were included and are they appropriate for the experiment performed?
- Are you convinced that the data are accurate and/or representative?
Discussion
Consider the following components of a discussion:
- Are the results summarized?
- Did the authors 'tie' the data together into a cohesive and well-interpreted story?
- Do the authors overreach when interpreting the data?
- Are the data linked back to the big picture from the introduction?
Next day: Complete data analysis and apply statistical methods