Cell Printing Experimentation
Once cartridge experimentation was completed, the next step was to try the device on cells themselves.
For cell solution, I used RFP-expressing and GFP-expressing E. coli, grown in L-broth to an approximate density of 10^8 cells/mL. This concentration equates to approximately 6 cells/droplet.
Contents
Experiment 1: Basic printing
Key Question Can cells be seen after the solution is printed?
Design The experimental design for this was quite simple--load the black ink cartridge with 0.5 mL of RFP E. coli and print onto a microscope slide.
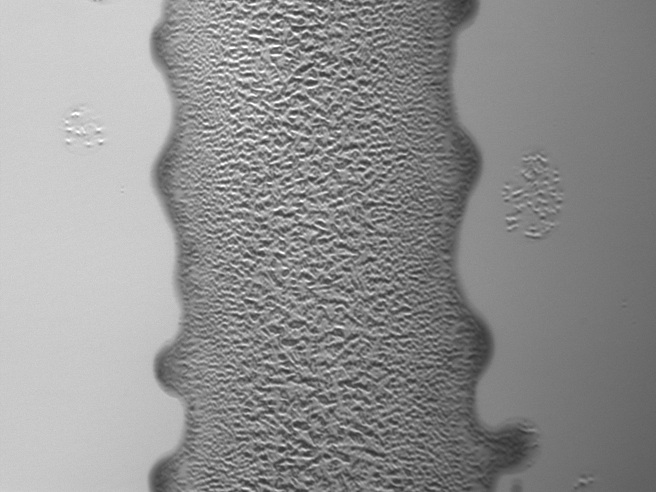
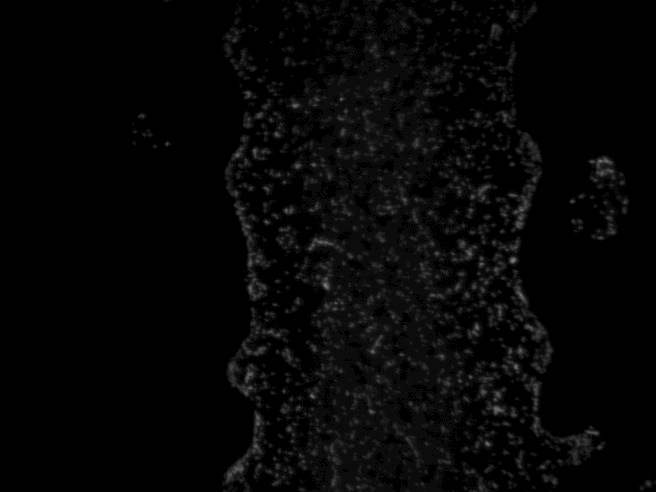
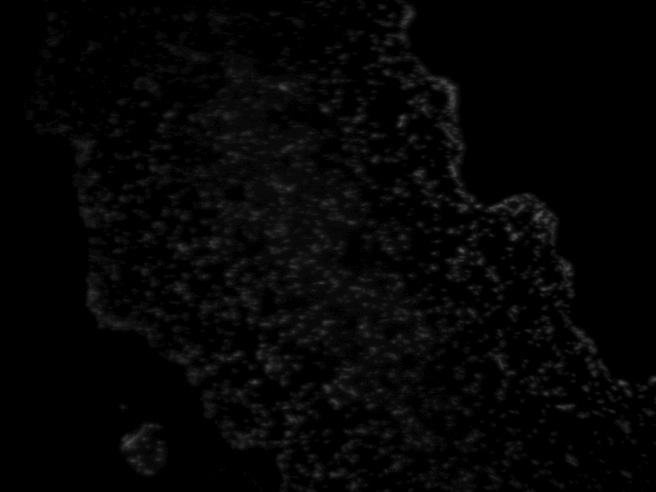
Result The cells did in fact print and they could be visualized in the defined pattern! However, the cells' fluorescence was fairly dim, making it hard to distinguish what was actually a cell and what was fluorescence from the solution that had also been transferred to the slide.
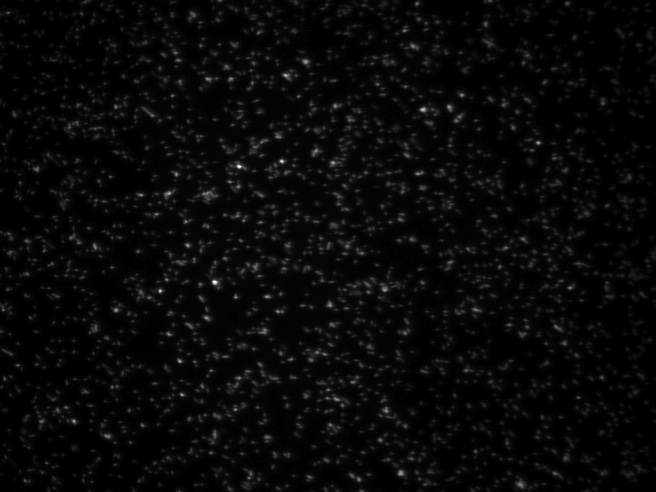
E. Coli at a concentration of 10^8 cells/mL (not printed)"
RFP E. coli imaged in brightfield and fluorescence - A defined pattern of E. coli is distinguishable, as seen in this image of one bar of an equals sign
Experiment 2: Viability
Key Question Are the cells able to grow after being printed?
Design After being printed, RFP E. coli were incubated in a humid chamber created by a vacuum grease seal and a second cover slip. After 30 minutes, the cover slip was removed and the sample was placed in a petri dish, at which point broth was added. The sample incubated at 37 degrees C for 24 hours.
Results Though fluorescence was still visibly patterned after 24 hours, it was hard to determine whether the cells had grown dramatically. Fluorescence was still fairly weak and a bit spotty, and individual cells were hard to distinguish. This may have been that the samples were allowed to dry out too much before adding the broth, meaning less overall growth was seen. Additionally, growth verification was difficult since images could not be taken beforehand as the sample was either vulnerable to high temperatures (i.e., drying out due to the laser heat) or was in broth.
RFP E. coli imaged in brightfield and fluorescence after 24 hours in broth
Experiment 3: Two-sample printing
Key Question Can two types of cells be printed in defined and integrated patterns?
Design The color cartridge was cleaned and the cyan channel was loaded with GFP-expressing cells, whereas the black cartridge was filled with RFP-expressing cells. The two were printed in the pattern seen below. Remember that lines that appear black should fluoresce red and lines that appear blue should fluoresce green.
Results Both red and green could be seen on the two-channel microscope in the 20.109 lab. However, due to time constraints and limits on equipment availability, clear cells were never able to be seen and imaged in two colors.
Experiment 4: Droplet Comparison
Key Question What surface and dpi yield the optimal droplet?
In trying to minimize drying, I tried to maximize surface area of the droplets by changing the type of surface on which I printed the samples. On glass, the contact angle of water is about 40 degrees, and a droplet size of 10 pL would spread to a diameter of almost 100 Microns due to the hydrophillic nature of the glass. I worried that this was causing the droplets to spread out on the glass and combine with one another, leading to inconsistencies in the printing pattern. Plastics such as thin transparencies, however, yield a higher contact angle with water, closer to 55 degrees, meaning that the drops are less likely to spread out and touch each other. Additionally, this more spherical droplet could also give the droplet more surface area, meaning it might evaporate slower. I also tried changing the dpi to see if an overall lower amount of liquid on the slide would cause the droplets to combine less.
Design Letters were printed onto both glass coverslips and plastic transparencies at maximum dpi. Then, on both glass and plastic, cells were printed in a gradient of maximum (1200) dpi to zero, alongside a contrasting line of constant max dpi.
Results Little difference could be seen between the plastic transparencies and glass. Though no formal experiment was conducted, it seemed as if the glass dried out slower than the transparencies.
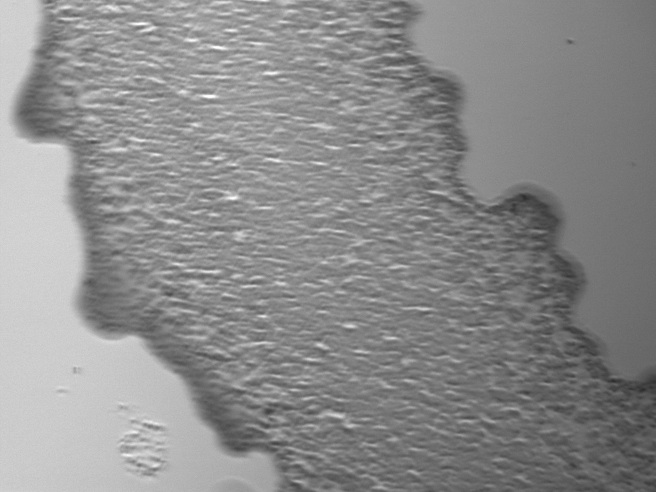
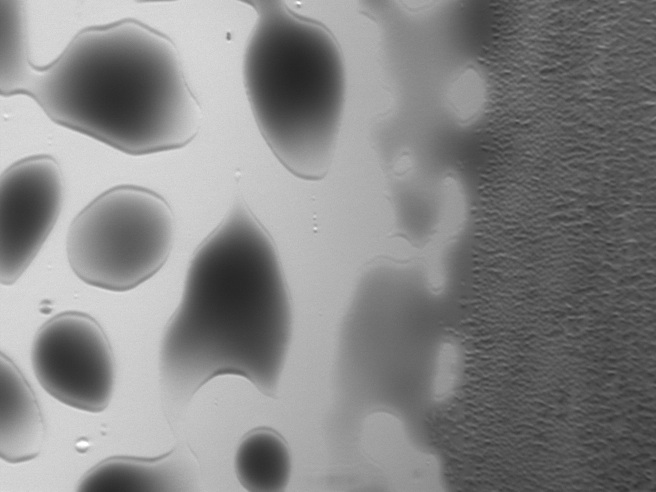
However, there was a dramatic difference between the lower and higer dpi, and surprisingly, the lower dpi beaded on the surface much more than the max dpi. The liquid did not stop beading because there was less fluid in those regions--instead, the beading became more defined because there were less drops to cover the space. This experiment confirmed that printing at maximum dpi was optimal.
Printed cells imaged in brightfield - the left side is printed at 750 dpi and the right side at 1200 dpi
