20.109(S23):M2D7

Contents
Introduction
In this laboratory session, you will complete the final two experiments of this module: analyzing metal uptake and tolerance in W303α cells expressing the Fet4_mutant you designed and generated.

In the last laboratory session, you prepared samples for analysis using inductively coupled plasma optical emission spectroscopy (ICP-OES). This technique is also known as ICP-AES, with the "A" representing "atomic". With this approach, a solution containing unknown elements is dissolved in acid to create a solution of soluble elements. These elements are pumped through a nebulizer to create a consistent fine spray. Inside the chamber, a quartz torch contained in an argon-cooled induction coil is lit, leading to the generation of a stable plasma "flame" capable of reaching 10,000K (the reported temperature on the surface of the sun).
As elements are aerosolized through the nebulizer, they are sprayed into the plasma where they are ionized with the electrons taking up the thermic energy emitted by the plasma and thus reaching an excited state. As the electrons fall back to ground level, they emit light at specific optical wavelengths that can be detected by the spectrometer. This approach allows us to determine the presence of elements in a sample by taking advantage of characteristic emission patterns of different elements.
To examine the ability of your transformed yeast to tolerate metal uptake, you will use a commercial assay to measure cell viability. The BacTiter-Glo Microbial Cell Viability Assay is a method for quantifying the number of viable cells based on measuring the amount of ATP present. ATP is a proxy for the presence of metabolically active (alive) cells. In this assay, the cells are lysed and ATP is released from the active cells. In a reaction catalyzed by a propriety luciferase enzyme, luciferin, ATP, and oxygen result in oxyluciferin, AMP, PPi, carbon dioxide, and light. The light product is then measured using a luminometer.
Protocols
Part 1: Perform metal tolerance experiment
- Obtain your Fet4_mutant culture from the front bench.
- Untransformed W303α and W303α transformed with Fet4 will be tested in parallel by the teaching faculty.
- Gently tritruate with a 1ml pipette to create a homogeneous suspension.
- Obtain cuvettes from the front bench to measure the OD600 of each culture prior to beginning the experiment.
- Add 1ml of each cell suspension to individual cuvettes and read on the spectrophotometer.
- Use 1ml SD-G for a blank.
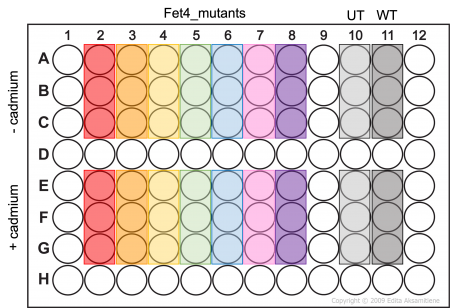 BacTiter-Glo assay map.
- Use 1ml SD-G for a blank.
- Record these numbers in your notebook.
- Using SD-G media as a diluent, dilute each of your cultures to OD600 ~ 1.0 and a final volume of 8ml split into two 4ml cultures. This does not have to be exact, but the cultures should have a similar OD600 before you begin the experiment.
- Add CdCl2 for a final concentration of 100μM in one culture and label it as +Cd.
- Incubate your labeled tubes shaking at 30°C for 2.5 hours to allow uptake.
- During this incubation time, complete Part 2 and 3 of the wiki.
- Following incubation, take an additional OD600 reading to account for any changes in culture density, and allow normalization of data across groups.
- Record this in your notebook.
- Add 100μL of cell suspension to the appropriate wells of an opaque-walled 96 well plate as shown in the plate map (Fet4_mutant cells -/+ cadmium will be assayed in triplicate).
- Add 100μL BacTiter-Glo reagent to each well containing cell suspension and mix.
- Incubate plate on orbital shaker, protected from light, for 5 minutes.
- Read the plate on a luminometer plate reader.

Part 2: Review collection of ICP-OES data

- Enter the ICP-OES facility and place samples in fume hood while setting up the equipment.
- Open the liquid argon regulator valve to begin the flow of argon gas to the ICP apparatus.
- Turn on the chiller to cool the ICP apparatus during operation.
- Tighten tubing connecting autosampler to nebulizer.


- Open the ICP Expert program and temporarily boost the argon gas flow to purge the system and maintain steady gas flow.
- Use the instrumentation panel in ICP Expert to light the plasma torch.
- Plasma must be burn for 20 minutes before data can be collected.
- Ensure collection probe is place in rinse solution.
- Place samples in autosampler.
- Before beginning experimental run, verify the following conditions to ensure machine is operational.
- Periodic bubbles present in drain lines for spray chamber and autosampler.
- Stable fog present in nebulizer sample chamber.
- Stable torch flame.
- Set the number of standards and samples on the autosampler map to set order of sample processing.
- Set parameters of sampling as listed below:
- 3 replicates per sample
- RF power = 1.2 kW
- pump speed = 12rpm
- read time = 5s
- rinse time = 30s
- stabilization time = 15s
- nebulizer flow = 0.70 L/min
- plasma flow = 12 L/min
- radial viewing mode
- viewing height = 8mm
- Set element and wavelength to be tested
- If unsure of which wavelength is ideal for elements under analysis, select all available wavelengths
- Save program file.
- Begin ICP-OES testing program.
Part 3: Analyze ICP-OES data
ICP-OES uses replicate measurements of each sample to identify signal intensity at wavelengths previously determined to be indicative of a particular metal. It is possible to examine all available wavelengths to identify any unknown metals in a sample, or to select particular wavelengths to focus on identifying particular metals of interest. Additionally, ICP-OES allows users to calibrate measurements against known metal standards to allow for a concentration measurement (in parts per million) of each identified metal in the sample.
Once a run is complete, multiple documents of data are generated to allow for detailed examination of the data. These data files have been uploaded to the Class Data tab of the wiki to allow for further analysis.
- Open the file called "Sp23_ICP-OES_Detailed with Calibrations". This file contains details on the experimental parameters used to collect data, the calibration curves for each standard at each wavelength tested, and all the raw data for both standards and samples.
- One key piece of data in this file is the linear relationship between the known concentrations of iron and cadmium in the standard curve at each wavelength. The data is plotted with an R-squared value, and the calculated concentration of each standard is calculated at each wavelength.
- Using this standard curve calibration data, consider the following questions and note them in your laboratory notebook.
In your laboratory notebook, complete the following:
- Are there any particular wavelengths that appear entirely accurate for measuring cadmium (looking at calculated ppm and fit of the standard curve)?
- Would you exclude any wavelengths from cadmium measurement based on their calibration?
- Consider these same questions for iron measurement.
ICP-OES is a well studied technique, and its analysis is continually being refined as new information is established. This also means that resources on best practices, and potential problems exist to guide scientists to obtain accurate results. One of these resources is linked here. This is an interactive periodic table meant to consolidate not only elemental information, but also information about potential sources of interference when using spectroscopy to identify the elemental composition of a sample.
- Click on cadmium in the periodic table and scroll down to "Atomic Spectroscopic Information" located at the bottom of the right-hand panel.
- The elements listed here can be sources of interference (and therefore inaccurate measurements) at the wavelengths listed.
Consider the following questions and note them in your laboratory notebook.
In your laboratory notebook, complete the following:
- Do you expect to see any potential interference from other elements in your sample? If so, which wavelengths are the most likely to be affected by interference?
Now that you had identified any problematic wavelengths that you want to exclude from your analysis, you can take a closer look at the data for each of the samples in the class.
- From the class data page, download the csv file. This file contains the data for all samples in a format more amenable to analysis. The first sheet of this file contains the data, and the second sheet contains a key to indicate the identity of each sample.
- There is a baseline control sample of untransformed W303α and a positive control sample of W303α cells transformed to overexpress Fet4 for each section.
- Identify the ppm for cadmium and iron for each control sample at the wavelength(s) of your choosing. Record these values in your notebook.
- Identify the ppm for your group's sample for cadmium and iron at the same wavelength(s)
- What does a lower ppm indicate? (Hint: think about the experimental set up)
- Record these values in your notebook.
Differences in metal uptake could be accounted for by different amounts of yeast present. To account for this, you will normalize your ppm concentration for each sample to the weight of yeast in that sample. Yeast culture weight is often used in place of cell number as a normalization metric, and that is what you will use as well.
However, you might remember that you have been recording optical density of your cultures at key points in the experiment. While optical density does have a relationship with cell number, it is not a perfectly linear relationship at all OD values. The relationship between optical density and cell number can also be influenced by the spectrophotometer used to establish optical density. In order to allow for normalization, the instructors have taken multiple measurements of optical density and pelleted yeast weight and used this data to generate equations that can be used to convert optical density to pellet weight. This data is attached here.
Two equations are included to describe this data. While the polynomial relationship provides a better fit for a range of OD measurements, for an OD600 under 2, there is a reasonable linear relationship between pellet weight and optical density. This is why you were asked to dilute your cultures to ~ OD600 = 1.
- Use the equation of your choosing to calculate the pellet weight for your sample. This will be used to normalize ppm reading across different groups. Record this in your notebook.
Record the ppm and OD600 value for your ICP-OES sample on the class data page.
- There are a number of ways to compare across experimental groups when examining this data. However, one straightforward way to approach analysis for this initial screen would be to compare the ppm for the Fet4_mutants to that of Sample 1 which contained 100μM cadmium chloride and iron chloride, but was not incubated with yeast cells. Upon determining the difference in concentration between these samples, it can be normalized to pellet weight of the yeast culture.
Reagents list
- BacTiter-Glo Microbial Cell Viability Assay solution (Promega)
- Synthetic dropout - galactose (SD-G) media: 0.17% yeast nitrogen base without amino acid and ammonium sulfate (BD Bacto), 0.5% ammonium sulfate (Sigma), 0.192 % amino acid mix lacking uracil (Sigma), 2% raffinose (Sigma), 2% galactose (Sigma), 0.1% adenine hemisulfate (Sigma)
- Cadmium chloride (Sigma), stock concentration= 100mM
- TraceCERT cadmium standard for ICP (Sigma)
- TraceCERT iron standard for ICP (Sigma)
Next day: Complete data analysis and organize Research article figures