20.109(S22):M2D2
Contents
Introduction
In this module you will engineer the metabolism of E. coli in an attempt to increase the production of a commercially relevant product. Specifically, use will use metabolic engineering to increase either the ethanol yield or acetate yield via manipulating the fermentation pathway native to E. coli cells using CRIPSRi.
Ethanol, or ethyl alcohol, is used as fuel – most commonly as a biofuel additive in gasoline. Current methods for producing ethanol involve the use of agricultural feedstocks and concern is mounting given the effect this may have on food prices and resources. Using E. coli as an ethanol-generating machine is promising; however, the ethanol output of a native cell is very low.
Acetate is a salt combined that results from the combination of acetic acid with an alkaline, earthy, or metallic base. The majority of the 5 billion kilograms of acetic acid produced each year by industry are used to produce acetates, which are then used in the production of polymers. As with ethanol, the use of E. coli to generate lactate is of interest, but the amount produced by a native cell is low.
Metabolic engineering refers to the alteration of genetic and/or regulatory circuitry within organisms. The native circuitry involves a series of enzymes that perform biochemical reactions that function to convert raw substrates into products that are required for the organism’s survival. When this native circuitry is altered using metabolic engineering techniques, the goal is to use the host organisms as machines that produce valuable materials in large quantities and at low cost.
Common strategies employed in metabolic engineering are:- Increasing expression of a gene that encodes an enzyme responsible for a rate-limiting step.
- Inhibiting competing pathways that divert substrate away from the pathway of interest.
- Incorporating genes from other organisms into the host.
- Altering the structure of the enzyme such that yield is increased.
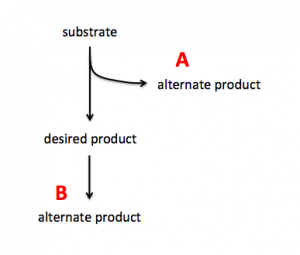
To increase production of a desired product, you can either target proteins that use the substrate to generate alternate products (see A in image on right) or you can target proteins that use the desired product to generate alternate products (see B in image on right). In A the substrate is siphoned away from the reaction that generates the desired product and in B the desired product is used as substrate in a subsequent reaction. By eliminating the proteins that catalyze the reactions that result in alternate products, you can potentially increase production of your desired product.
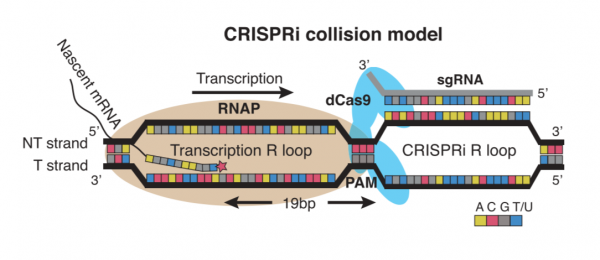
To engineer the metabolism of E. coli, you will use the CRISPRi system. Unlike more commonly used CRISPR-based technologies, CRISPRi is used to modulate expression from the genome rather than to modify the genome. This distinction is due to the use of an enzymatically-inactive dCas9 (or ‘dead’ Cas9) protein. Because dCas9 is enzymatically inactive, it is unable to cleave the DNA upon binding to the targeted sequence in the host genome. The lack of DNA cleavage results in gene silencing through impeding RNA polymerase binding, transcription factor binding, and/or transcription elongation. This method of repression referred to as CRISPRi collision and depicted in the schematic below.
Protocols
Part 1: Electrophorese confirmation digest
Electrophoresis is a technique that separates large molecules by size using an applied electrical field and a sieving matrix. DNA, RNA and proteins are the molecules most often studied with this technique; agarose and acrylamide gels are the two most common sieves. The molecules to be separated enter the matrix through a well at one end and are pulled through the matrix when a current is applied across it. The larger molecules get entwined in the matrix and are stalled; the smaller molecules wind through the matrix more easily and travel farther away from the well. The distance a DNA fragment travels is inversely proportional to the log of its length. Over time fragments of similar length accumulate into “bands” in the gel. Higher concentrations of agarose can be used to resolve smaller DNA fragments.
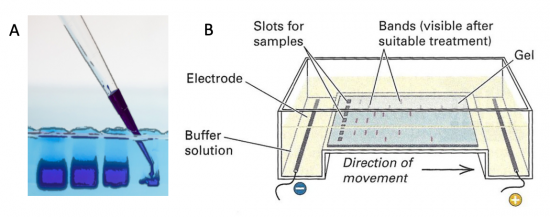
DNA and RNA are negatively charged molecules due to their phosphate backbone, and they naturally travel toward the positive electrode at the far end of the gel. Today you will separate DNA fragments using an agarose matrix. Agarose is a polymer that comes from seaweed. To prepare these gels, agarose and 1X TAE buffer (Tris base, acetic acid, and EDTA) are microwaved until the agarose is melted and fully dissolved. The molten agar is then poured into a horizontal casting tray, and a comb is added. Once the agar has solidified, the comb is removed, leaving wells into which the DNA samples can be loaded.
For the digests that were prepared in the previous laboratory session, a 1% agarose gel with SYBR Safe DNA stain was used to separate the DNA fragments in the four digest reactions. In addition, a well was loaded with a molecular weight marker (also called a DNA ladder) to determine the size of the fragments.
To ensure the steps included below are clear, please watch the video tutorial linked here: [DNA gel electrophoresis].
- Add 5 μL of 6x loading dye to the digests.
- Loading dye contains bromophenol blue as a tracking dye, which enables you to follow the progress of the electrophoresis.
- Glycerol is also included to weight the samples such that the liquid sinks into well.
- Flick the eppendorf tubes to mix the contents, then quick spin them in the microfuge to bring the contents of the tubes to the bottom.
- Load 25 μL of each digest into the gel, as well as 5 μL of 1kb DNA ladder.
- Be sure to record the order in which you load your samples!
- To load your samples, draw the volume listed above into the tip of your P200 or P20. Lower the tip below the surface of the buffer and directly over the well. Avoid lowering the tip too far into the well itself so as to not puncture the well. Expel your sample slowly into the well. Do not release the pipet plunger until after you have removed the tip from the gel box (or you'll draw your sample back into the tip!).
- Once all the samples have been loaded, attach the gel box to the power supply and electrophorese the gel at 125 V for 45 minutes.
- Lastly, visualize the DNA fragments in the agarose gel using the gel documentation system.
Part 2: Review E. coli anaerobic fermentative metabolism
Across many fields of science, E. coli is a valuable tool in research related to genetic systems, metabolic pathways, and physiological responses. It is often called the 'workhorse' of bench science. There are many reasons for this role including: 1) E. coli cultures are easy to grow in the laboratory, 2) E. coli is a genetically tractable system, 3) E. coli metabolic pathways are defined and, 4) the breadth of research available for E. coli in literature. For all of these reasons, E. coli is ideal for use this module!
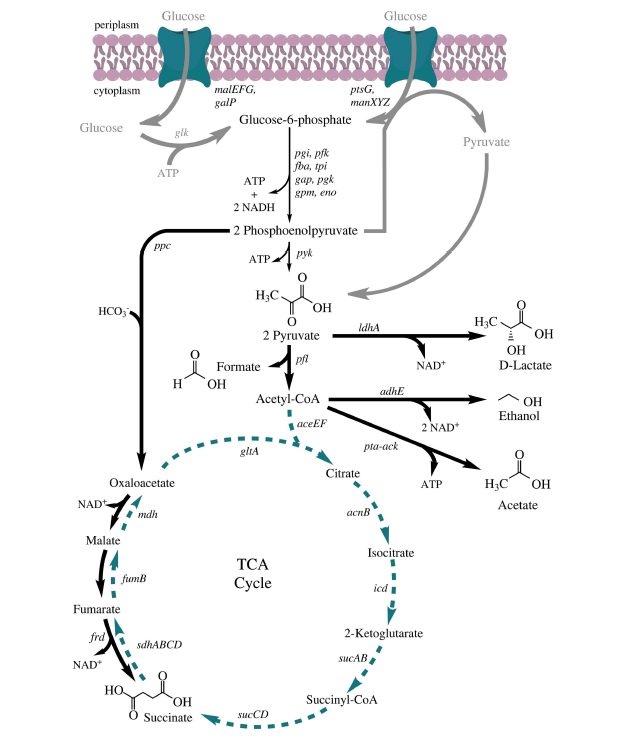
We will take advantage of the genetic tools available for engineering the genetics of E. coli to increase ethanol or acetate yield. In E. coli, these products are produced via the mixed-acid pathway which is used by cells under fermentative conditions to maintain redox balance. With your laboratory partner, review the metabolic pathway map below. Specifically, identify at which step ethanol is produced.
In your laboratory notebook, complete the following:
- Which gene(s) are responsible for ethanol / acetate production? Provide a brief description of the reaction (ie what is substrate? are biproducts generated?).
- Which gene(s) might you target using the CRISPRi system to increase the availability of substrate for ethanol / acetate production?
- Which gene(s) might you target using the CRISPRi system to decrease the amount of substrate used to generate products in steps downstream of ethanol / acetate production?
- From the list of possible gene targets, which do you think is the most promising candidate for increasing ethanol / acetate yield? Why?
Part 3: Research CRISPRi system
Review and discuss the Introduction and the first Results sub-section ('A minimal CRISPRi system consists of a single protein and RNA and can effectively silence transcription initiation and elongation') from the following journal article with your laboratory partner:
Lei et al. "Repurposing CRISPR as an RNA-guided platform for sequence-specific control of gene expression." Cell. (2013) 152:1173-1183.
In this article, the researchers describe a modified CRISPR system, referred to as CRISPR interference (CRISPRi), that inhibits transcription of genes that are targeted using single guide RNA (sgRNA) molecules. The goal of this exercise is to understand how the sgRNA molecules are used to target specific genes. In the CRISPRi system, sgRNA forms a complex with dCas9 and this complex binds to the sequence in the genome that is complementary to the sgRNA molecule. Thus, the sgRNA targets a specific gene sequence in the host genome. When the sgRNA / dCas9 complex binds, transcription of the gene is inhibited.
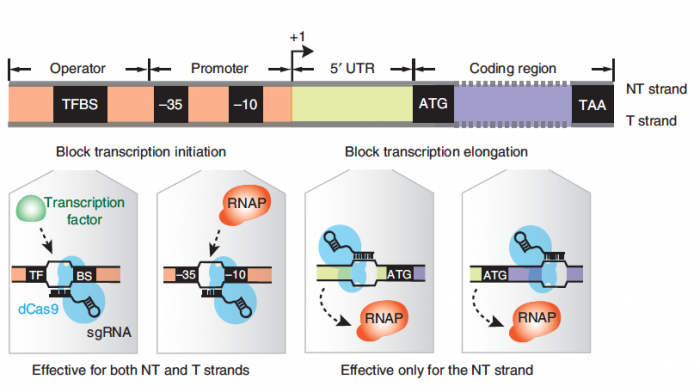
Transcription can be blocked by targeting sgRNA molecules to the promoter or coding region of a specific gene. The promoter is the region upstream of the start codon and contains the RNAP binding site, or the -10 and -35. When the sgRNA / dCas9 complex binds to the promoter, transcription initiation is inhibited because RNAP is unable to bind to the promoter. The coding region refers to the gene sequence. When the sgRNA is targeted to the coding region, transcription elongation is stalled because RNAP is unable to traverse beyond the location of the sgRNA / dCas9 complex.
In your laboratory notebook, complete the following with your partner:
- Briefly, describe how the CRISPRi system is different than the native CRISPR system that was discussed during lecture.
- Hint: Which two components were modified? How?
- In the first paragraph of the Results sub-section, what are the researchers testing?
- Describe the red fluorescent protein (mRFP)-based reporter system.
- Where was the mRFP gene sequence inserted?
- What does this system enable the researchers to test?
- For Fig. 2C, describe the schematic of the mRFP-based reporter system (top of the panel).
- What are each of the components and what is the purpose of each?
- What does it mean if RFP is expressed from this construct? If RFP is not expressed from this construct?
- For Fig. 2C, explain the data that are shown (bottom of the panel).
- What is the control?
- What do these data tell you about how to best target the coding region of a gene using sgRNA molecules and the CRISPRi system?
- For Fig. 2D, describe the schematic of the experimental approach (top of panel).
- How does this experiment relate to what is shown in Fig. 2C?
- The output from this experimental approach is RFP. Where is the RFP insert? How does this approach relate to the mRFP-based reporter system?
- For Fig. 2D, explain the data that are shown (bottom of the panel).
- What is the control?
- What do these data tell you about how to best target the promoter region of a gene using sgRNA molecules and the CRISPRi system?
- Lastly, given the results from this article what is the best approach for targeting the promising candidate you identified above in Part 1?
- Should you design an sgRNA that targets, or binds, the promoter or the coding region? The template or the non-template strand?
- Where in the promoter or coding region should the sgRNA bind (ie the -35 or the middle of the gene)?
Part 4: Design gRNA for CRISPRi system
Your main task for today is to use the insight from the above exercises to decide which gene you will target. Next, you will decide on the approach you will use to optimize ethanol / acetate yield! After choosing which byproduct you want to increase and which gene you think is the best target, consider specifics of your gRNA sequence.
In your laboratory notebook, complete the following with your partner:
- Decide on a target.
- Which byproduct will you attempt to increase (ethanol or acetate)?
- Which gene you will target?
- Will you target the promoter or the coding region of the gene you selected.
- Provide the rational for your design choice.
- Why do you think the target gene you selected is better than the other option?
- Why do you think targeting the promoter / coding region is best?
- Complete the sgRNA Design Worksheet (linked here).
Now that have a strategy for optimizing ethanol / acetate yield using the CRIPSRi system, you need to design a sgRNA molecule using the DNA sequence of the target gene. As a reminder, the sgRNA recruits dCas9 to a specific location in the genome where it will bind and block transcription. The CRISPRi system can block transcription at either the initiation or elongation steps of transcription as illustrated in the figure below. If the dCas9 protein is bound to the promoter sequence at either a transcription factor binding site (TFBS) or the -10 / -35 boxes it will block transcription factors and / or RNA polymerase from binding to the promoter of the gene, thereby impeding transcription initiation. If the dCas9 protein is bound within the gene it will impede RNA polymerase elongation of the transcript, or if dCas9 is bound within the gene at a TFBS transcription could be inhibited due the role of the TF in gene expression.
- To design your sgRNA_target, use the KEGG Database to obtain the DNA sequence of the target gene in the E. coli K-12 MG1655 strain.
- Enter the name of your target gene in the Search genes box and click Go.
- Double click on the linked gene name.
- Determine the position of your gene within the genome by clicking the Genome map button within the Position row.
- Is your target gene at the start of an operon or in the middle?
- Does the position of your gene within the operon affect the sgRNA targeting strategy you discussed with your partner? If you are unsure, consult with the Instructors.
- The amino acid (AA) sequence and nucleotide sequence (NT) of your gene are provided at the bottom of the page.
- Generate a new DNA file in SnapGene that contains the NT sequence of your gene.
- If you will design an sgRNA_target that binds the promoter, enter 50 in the +upstream box to get the 50 basepair sequence immediately preceding the start codon.
- Use the DNA sequence to select a 20-25 basepair region that will serve as the sgRNA_target binding site. Please make sure your sequence does not exceed 25 bp.
- If you target the template DNA strand, the sgRNA_target sequence will be the same as the transcribed sequence.
- If you target the nontemplate strand, the sgRNA_target sequence will be the reverse-complement of the transcribed sequence.
- Attempt to find a sequence to target that contains a PAM sequence (Any nucleotide - G - G) See figure in prelab for details
- To avoid off-target effects, check the specificity of your sgRNA_target sequence using the Basic Local Alignment Search Tool (BLAST) available from NCBI.
- Click on the Nucleotide BLAST icon.
- In the Enter Query Sequence section, paste your sgRNA_target sequence into the Enter accession number(s), gi(s), or FASTA sequence(s) box.
- In the Choose Search Set section, type 'MG1655' in the Organism box and select an appropriate option from the drop down list.
- Click the BLAST button at the bottom of the screen.
- Ideally, your sgRNA_target sequence will only have 100% identity to the target sequence.
- If your sgRNA_target sequence binds to multiple locations (with a 14+ nucleotide region within the gRNA having 100% identity to an off-target) within the genome, consider redesigning your sgRNA_target.
In your laboratory notebook, complete the following:
- Record your sgRNA_target sequence and the requested information on the Class data tab.
- Be sure you write your gRNA sequence 5' → 3'.
- Recall that additional sequence information must be added to your sgRNA_target for the CRISPRi system. A 'handle' is required for dCas9 binding to the sgRNA. The tag sequence 5' - GTTTTAGAGCTAGAAATAGCAAGTTAAAATAAGGC - 3' should be included at the 3' end of your sgRNA_target. Please double check that in total, the full sequence is 60 bp or fewer.
- Provide the rational for your design choice.
- Why did you choose to target the specific basepair sequence in the promoter / coding region?
Reagents list
- 1X TAE gel electrophoresis buffer: 40 mM Tris, 20 mM acetic acid, 1 mM EDTA (from BioRad)
- 6X gel loading dye, blue (from NEB)
- 1 kb DNA ladder (from NEB)
- SYBR Safe DNA gel stain (from ThermoFisher)
Next day: Clone psgRNA expression plasmid

