20.109(S19):Class data

Contents
Module 1: Assessing ligand binding
M1D3: SMM analysis
Files for SMM analysis
GAL files linked here.
Scan images and set numbers assigned to each team:
| Team | Slide #1 | Slide #2 |
| T/R | ||
| Red | 14399983, set 1 | 14400077, set 4 |
| Orange | 14400113, set 2 | 14400139, set 3 |
| Yellow | 14400114, set 2 | 14400140, set 3 |
| Green | 14399984, set 5 | 14399988, set 6 |
| Blue | 14400072, set 5 | 14399987, set 6 |
| Pink | 14399983, set 1 | 14400128, set 7 |
| Purple | 14400077, set 4 | 14399959, set 8 |
| White | 14400129, set 7 | 14400081, set 9 |
| Grey | 14400128, set 7 | 14399959, set 8 |
| W/F | ||
| Red | 14400129, set 7 | 14400081, set 9 |
| Orange | 14400128, set 7 | 14399959, set 8 |
| Yellow | 14400143, set 11 | 14399950, set 12 |
| Green | 14400147, set 10 | 14399951, set 12 |
| Blue | 14400146, set 10 | 14399947, set 11 |
| Pink | 14399983, set 1 | 14400077, set 4 |
| Grey | 14400113, set 2 | 14400139, set 3 |
In spring 2017 Rob Wilson manually confirmed the top-ranking ~1000 compounds of the class's SMM screen. 72 can be recognized as hits with high confidence, and in total, 134 would be worth a hypothetical secondary screen. This corresponds to hit rate of about 0.15%, low and reasonable in the Koehler Lab's viewpoint. The conserved structures Rob identified are: a 7-azaindole and a 3,4 cis pyrrolidine with a nearby tertiary amine non-aromatic heterocycle.
Ligand selections
| Team | Ligand #1 (short #) | Ligand #2 (short #) |
| T/R | ||
| Red | 31064975 (15) | 13742946 (16) |
| Orange | 83759472 (2) | 34120495 (13) |
| Yellow | 83759472 (2) | 64183606 (5) |
| Green | 85836506 (1) | 41507070 (11) |
| Blue | 71743840 (14) | 64472564 (4) |
| Pink | 47464042 (8) | 85836506 (1) |
| Purple | 47464042 (8) | 63365116 (6) |
| White | 62716075 (7) | 45527639 (10) |
| Grey | 62716075 (7) | 64472564 (4) |
| W/F | ||
| Red | 41507070 (11) | 13742946 (16) |
| Orange | 34297777 (12) | 64183606 (5) |
| Yellow | 45714400 (9) | 31064975 (15) |
| Green | 34120495 (13) | 71743840 (14) |
| Blue | 65421147 (3) | 45527639 (10) |
| Pink | 63365116 (6) | 45714400 (9) |
| Grey | 41507070 (11) | 65421147 (3) |
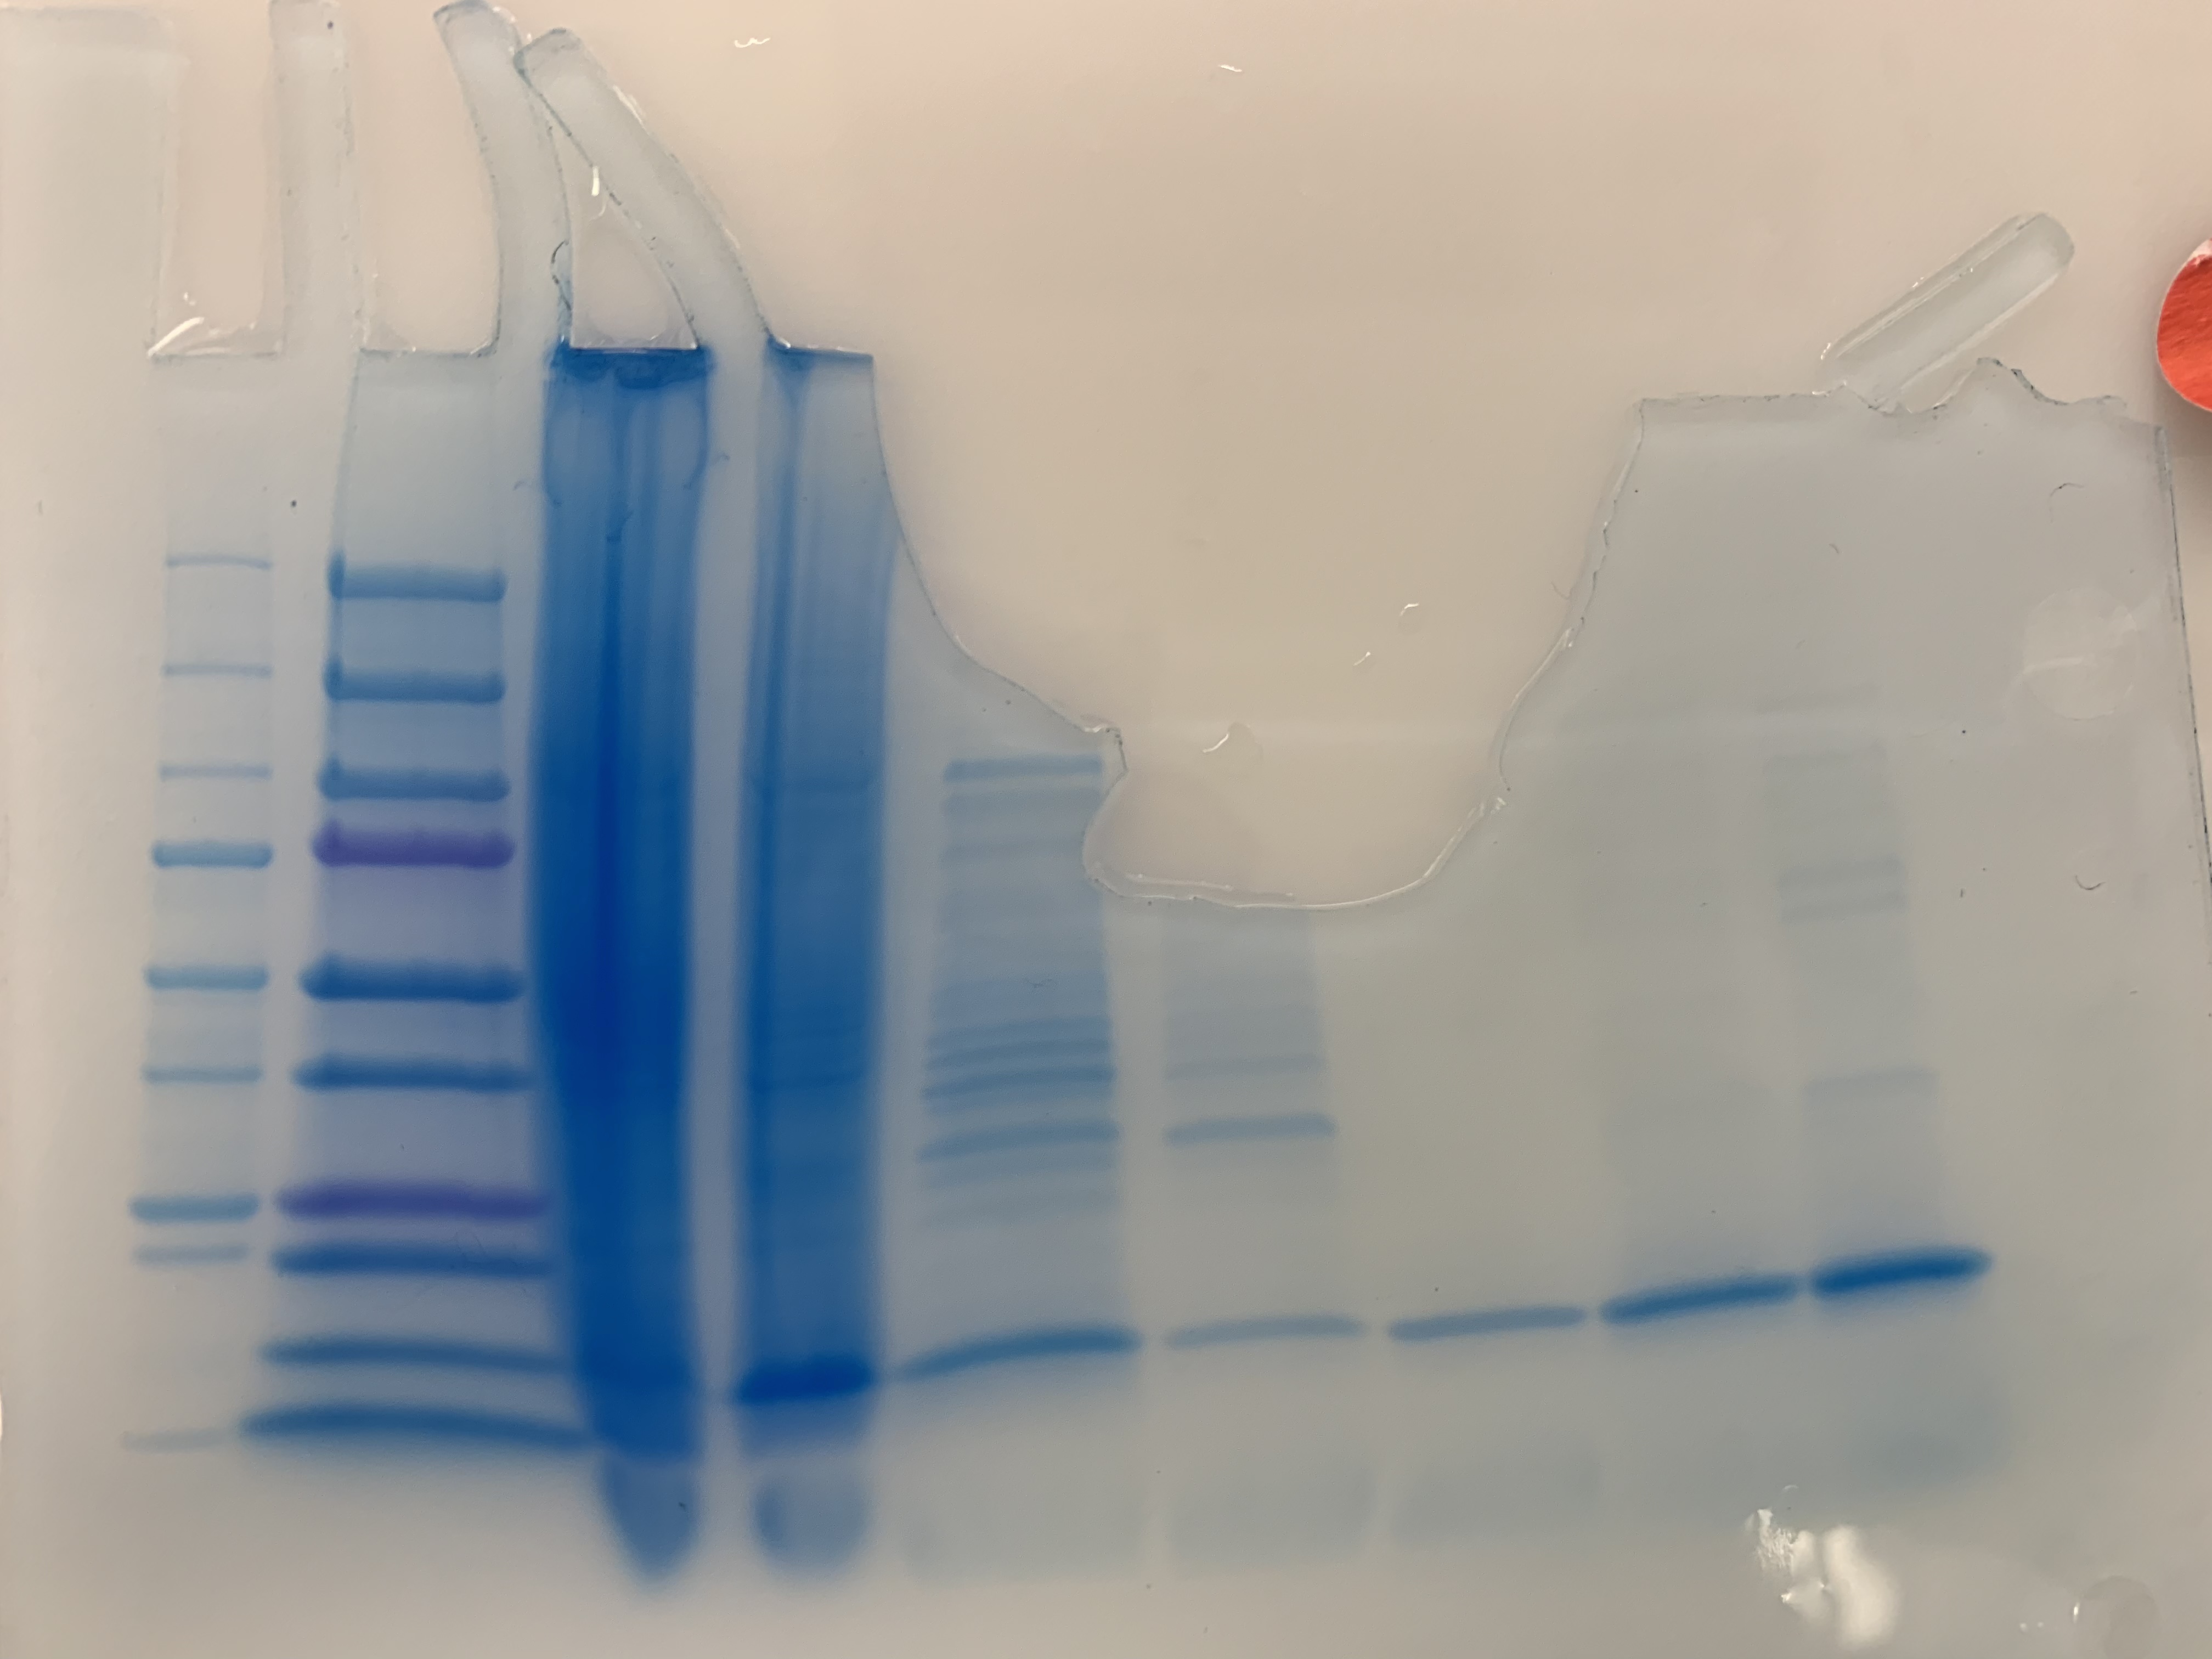
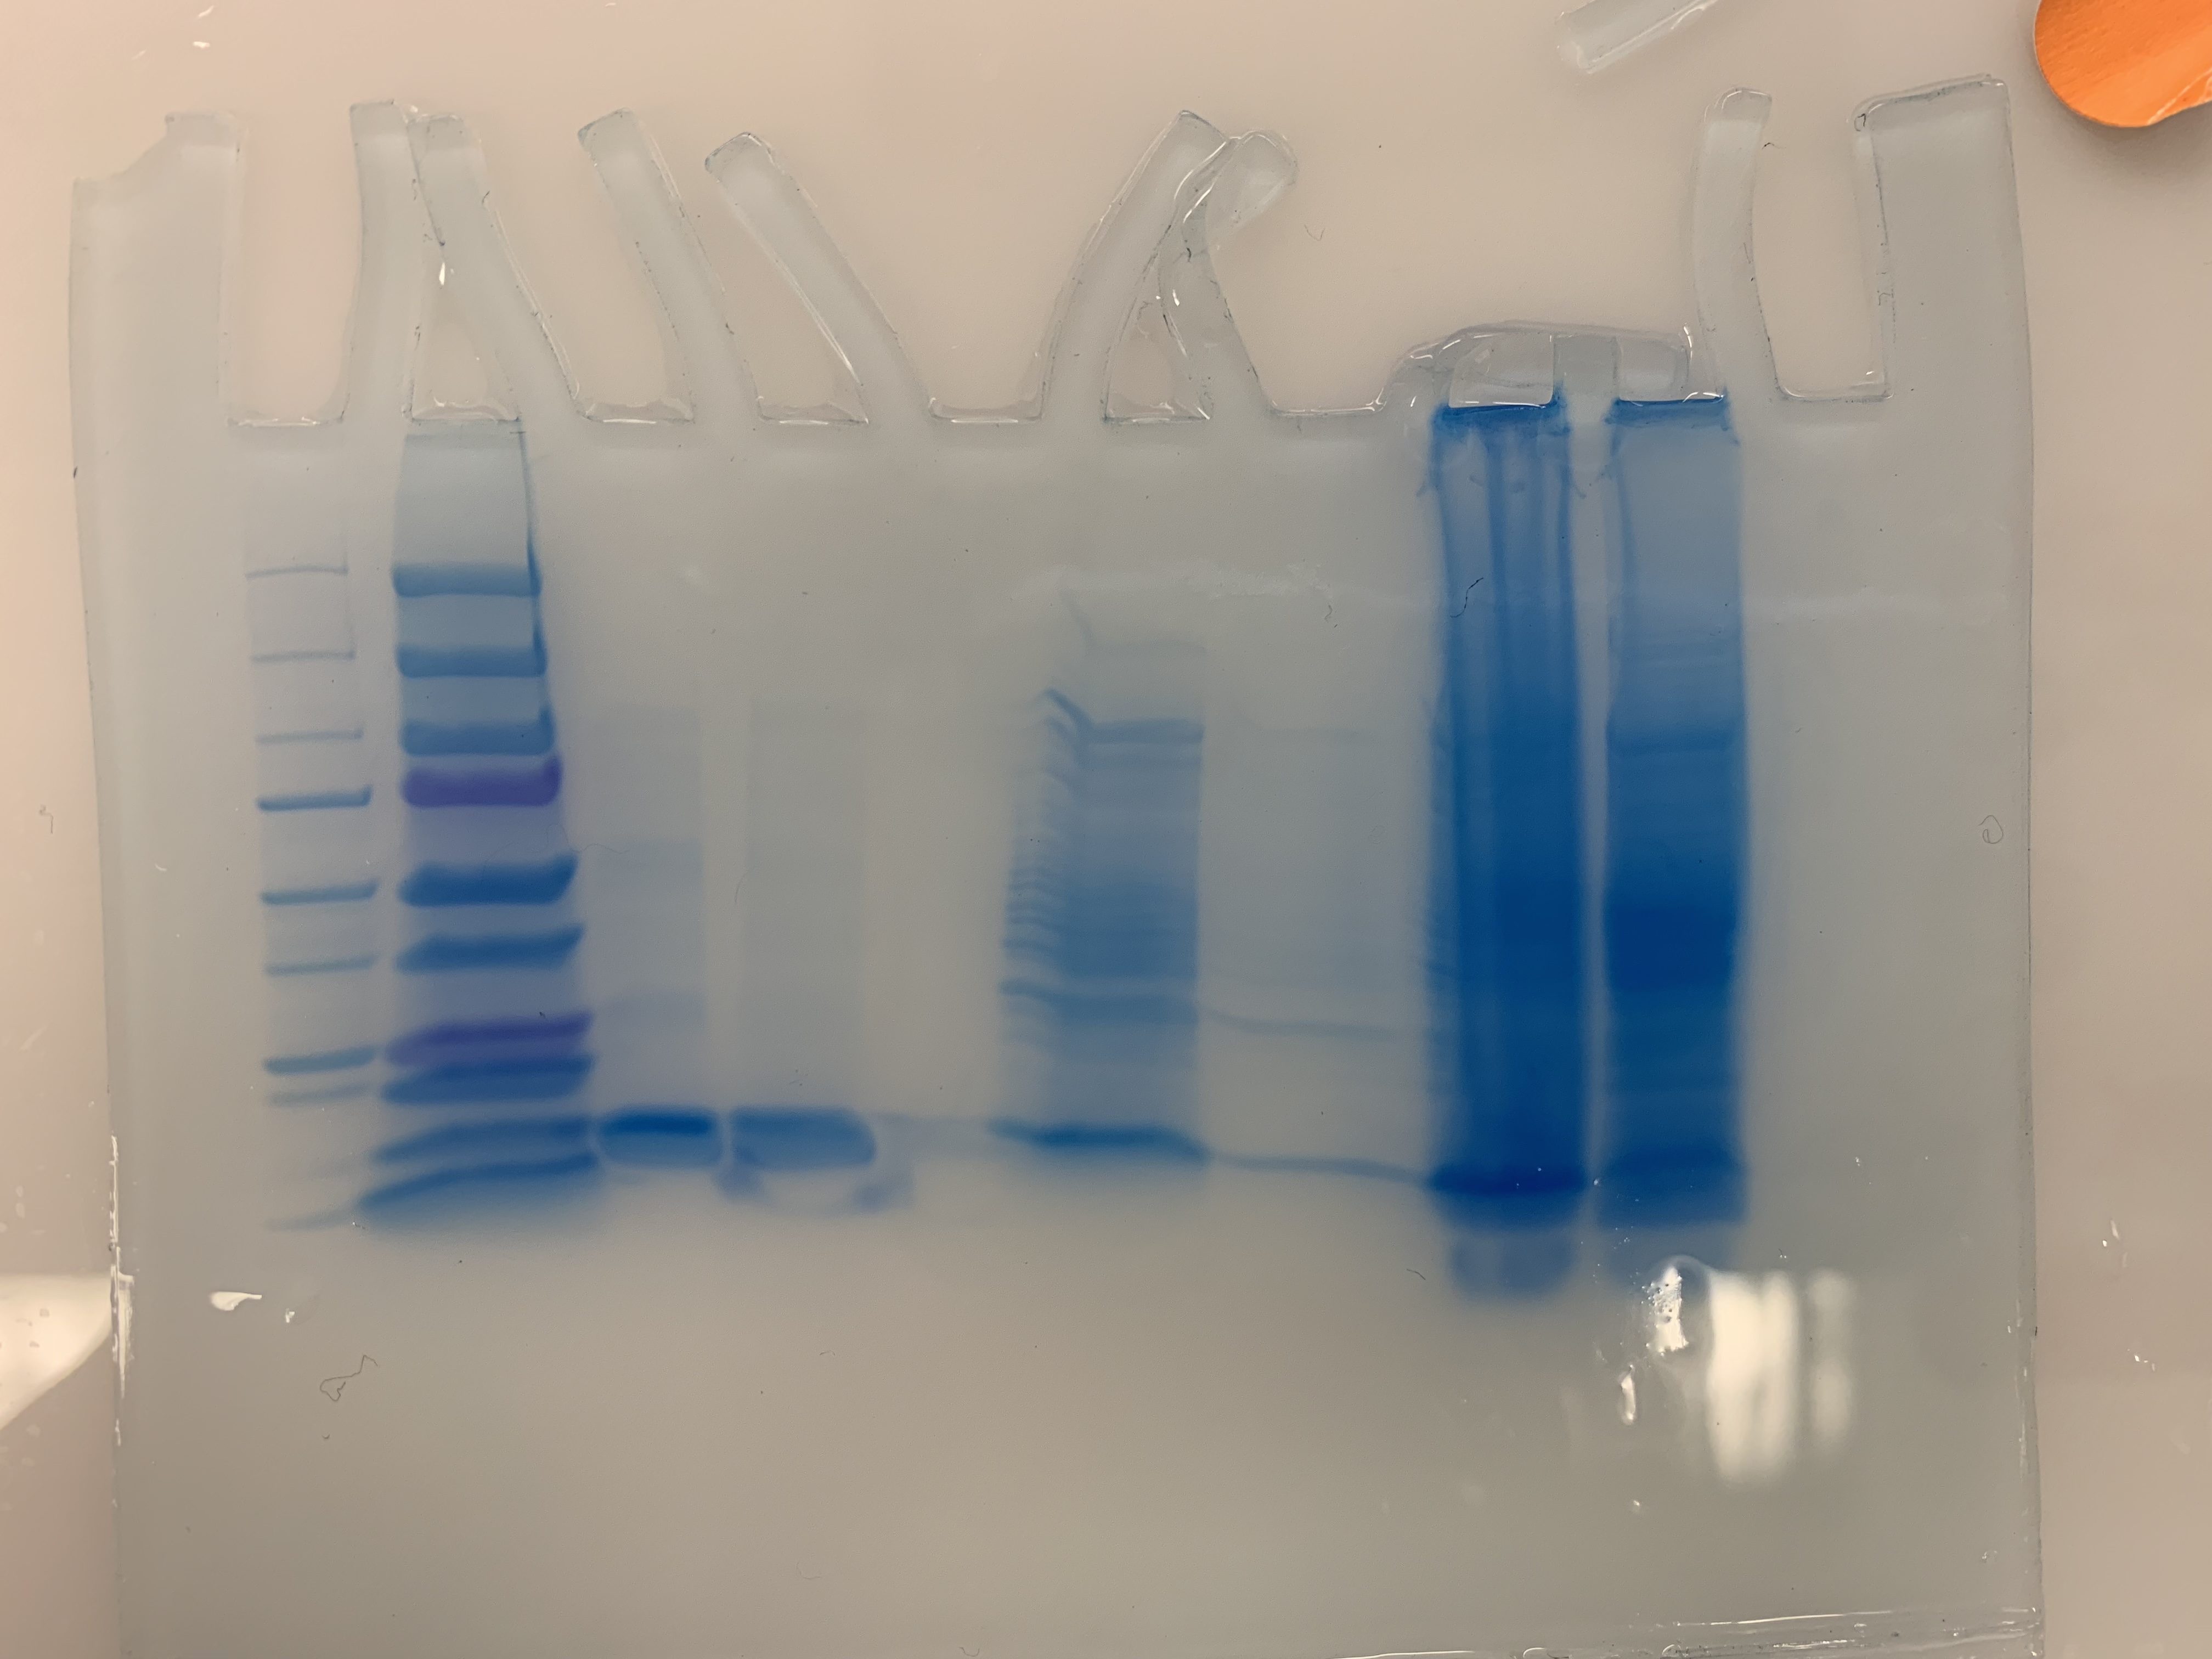
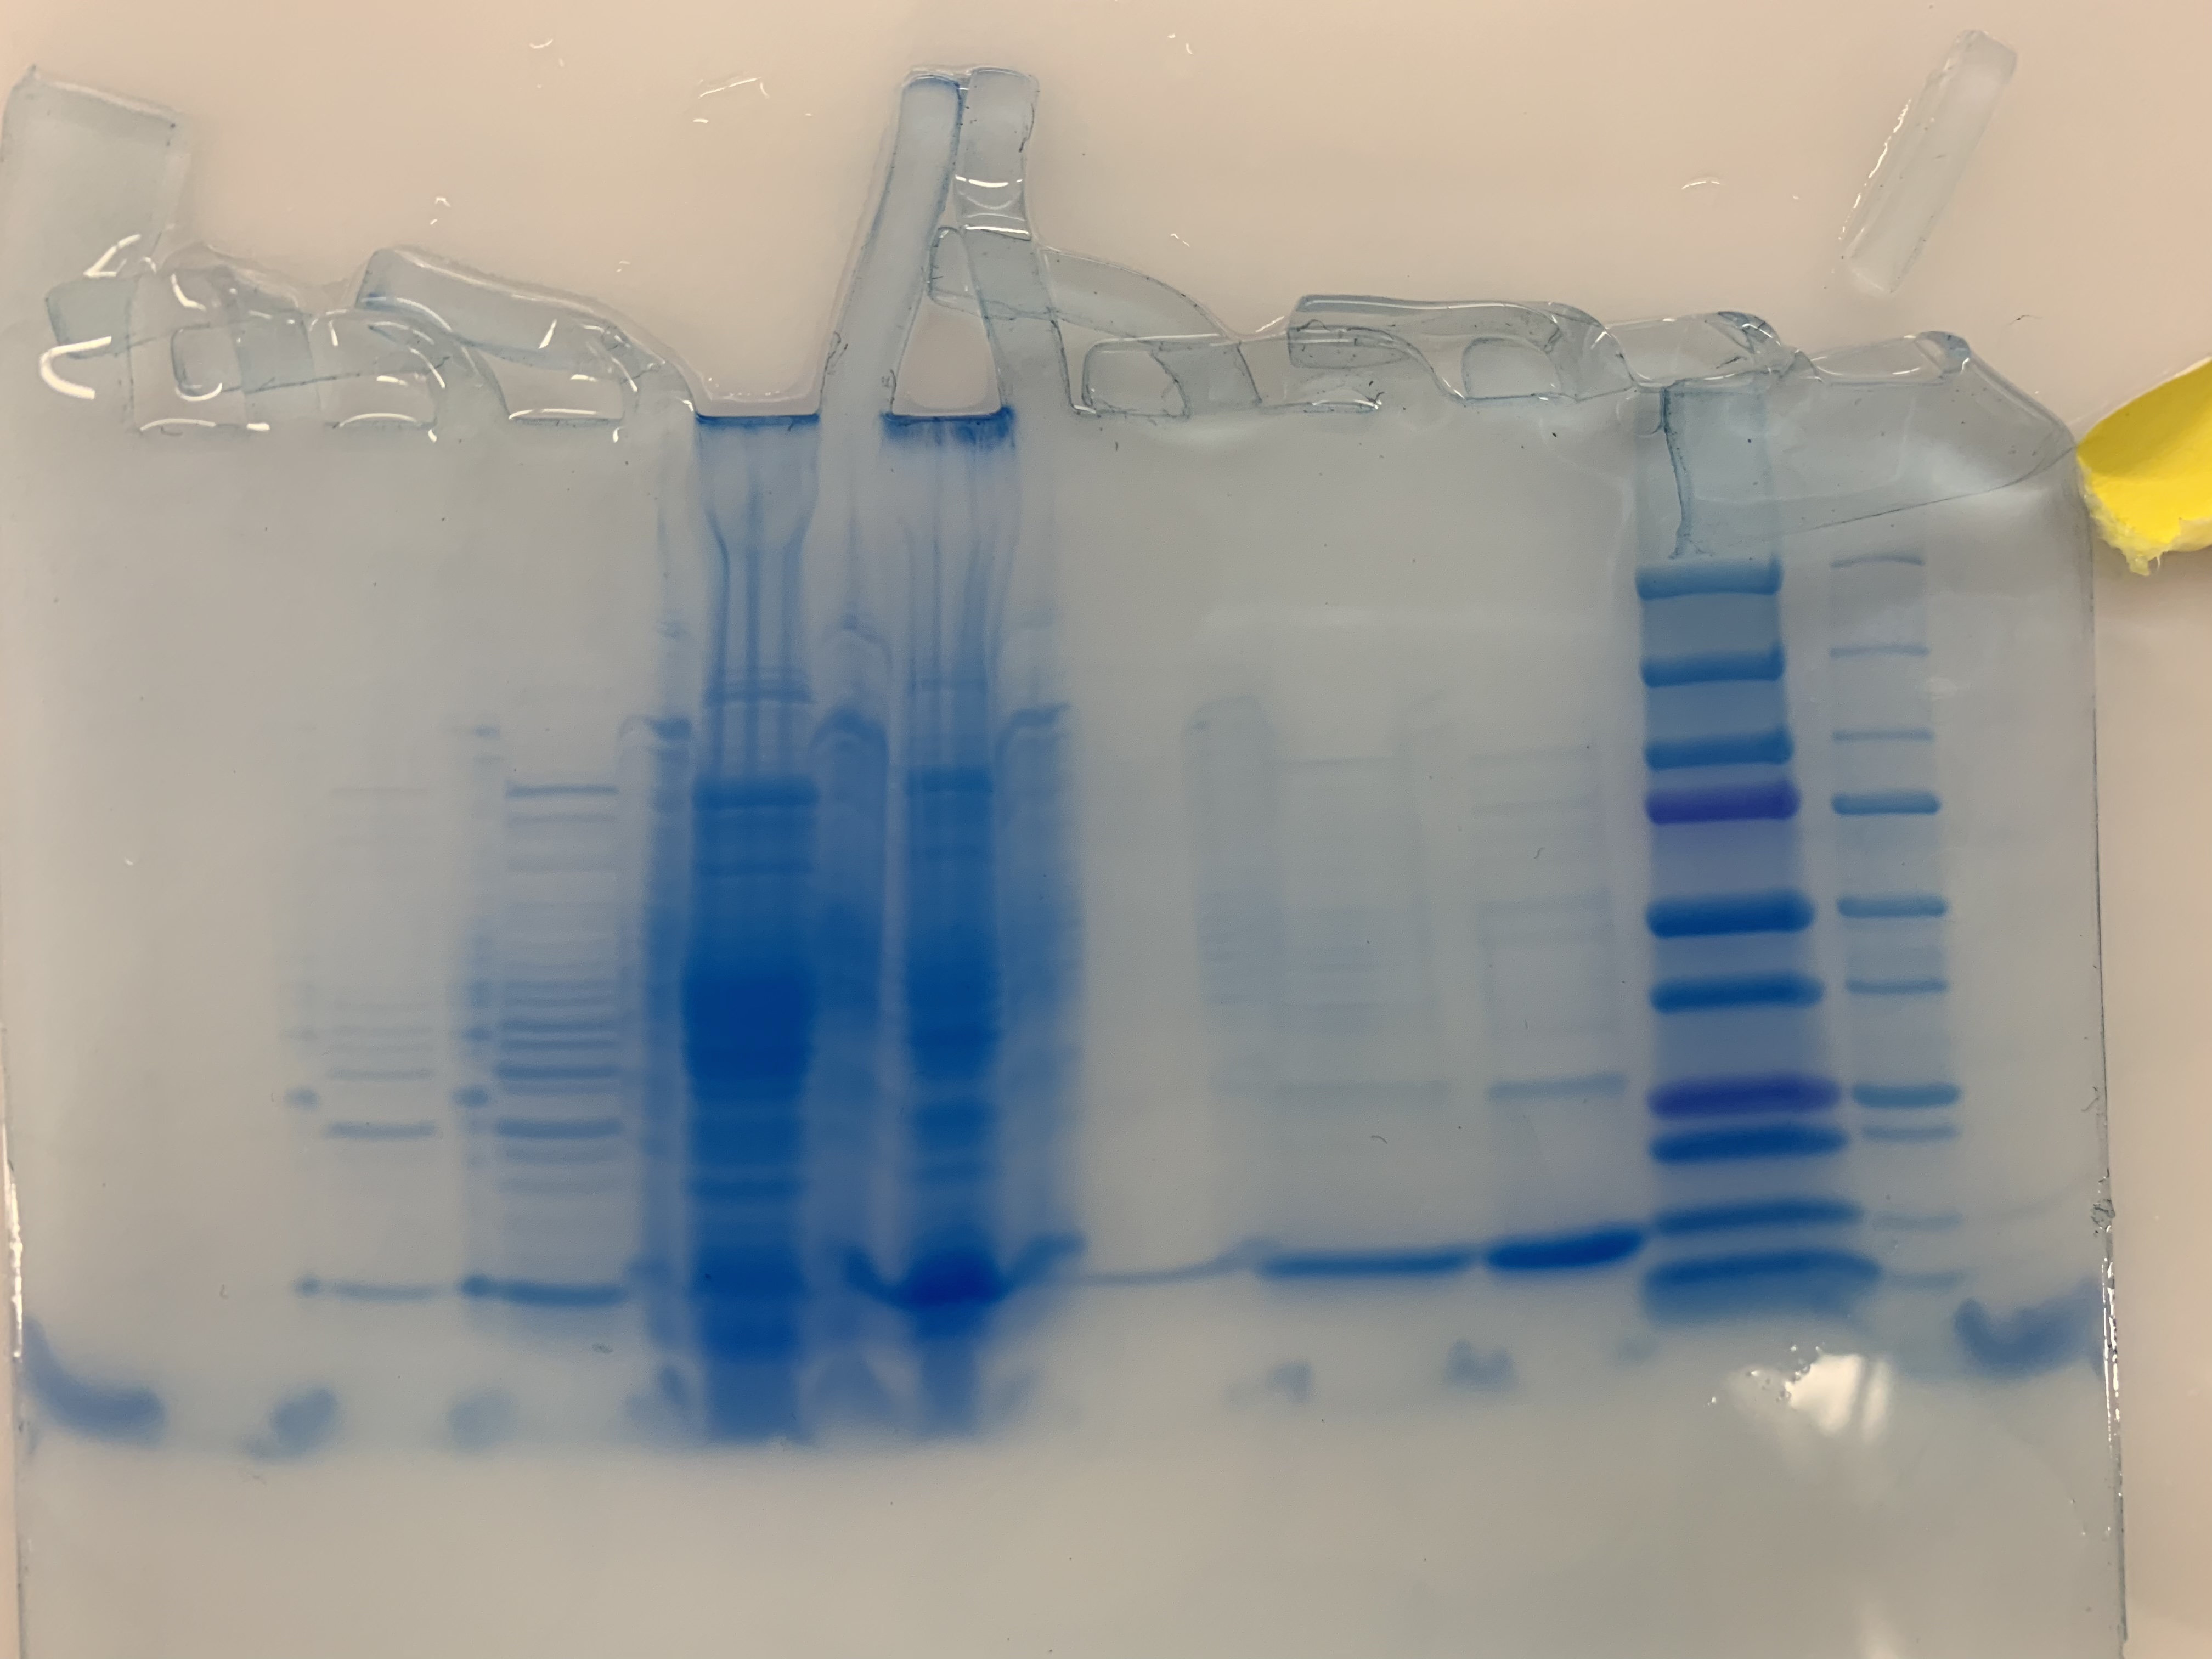
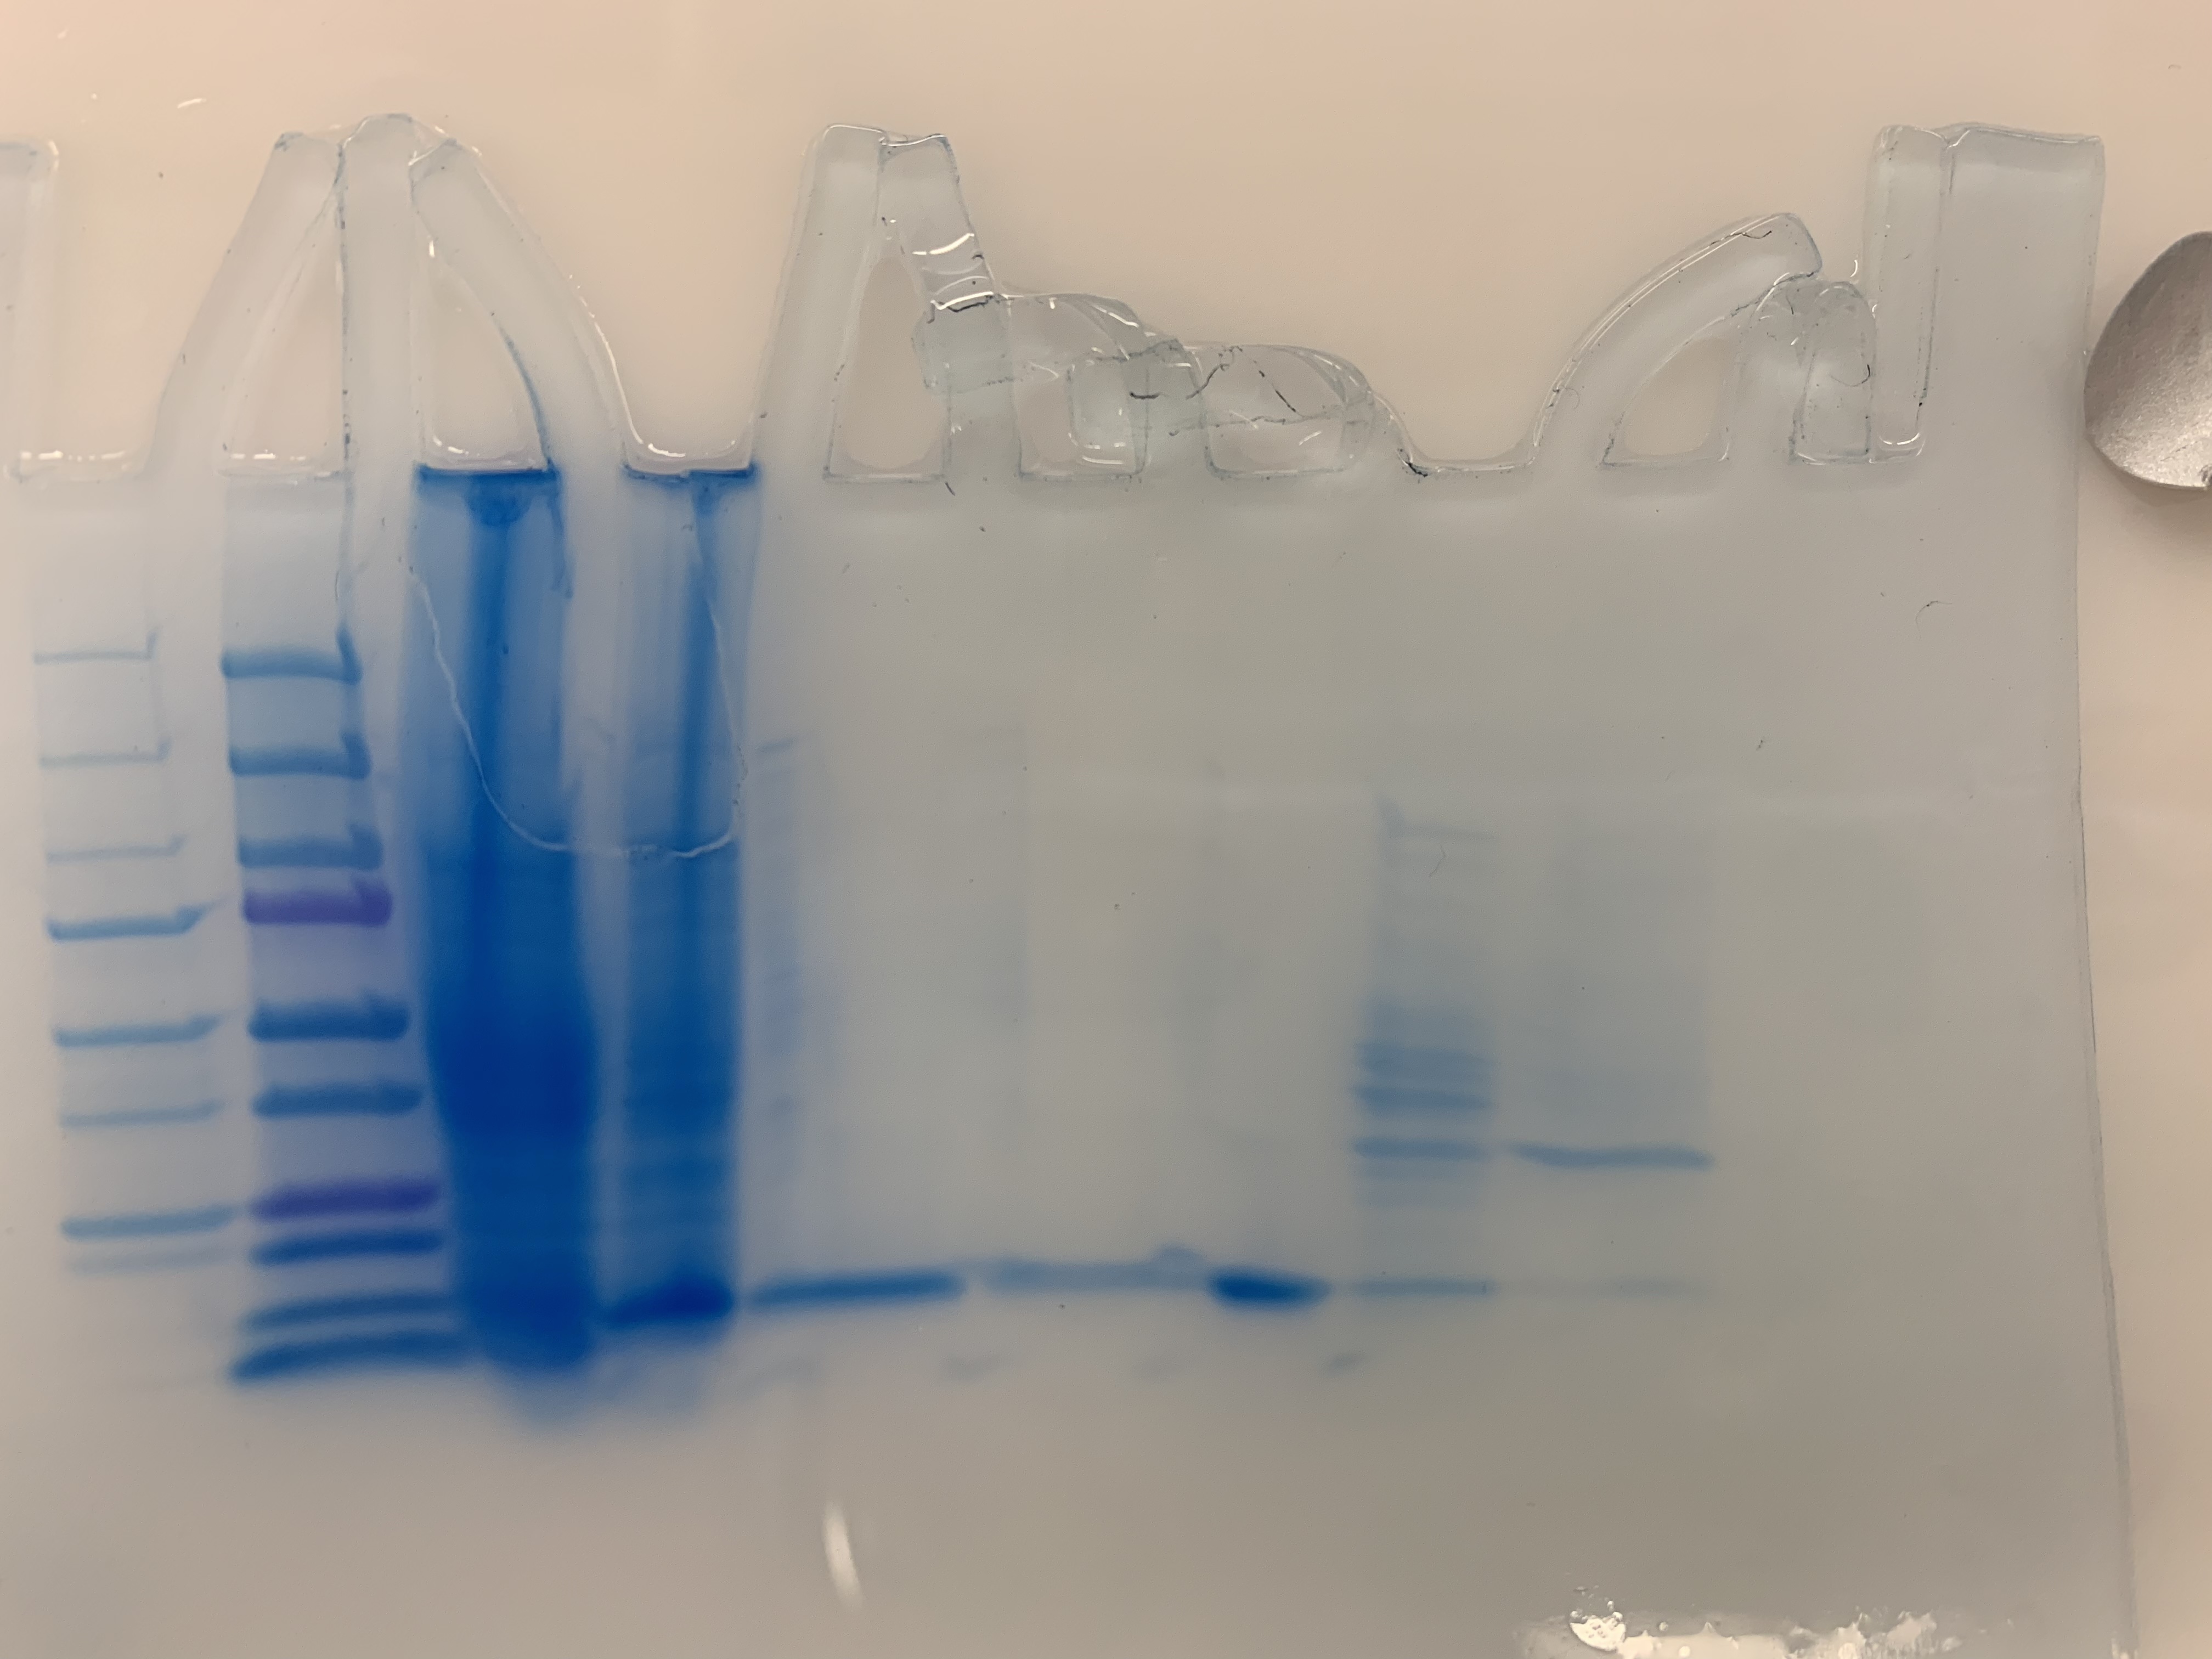
M1D3: Evaluate protein purity and concentration
WF Section
BCA Assay results (A562 measurements): linked here
SDS-PAGE images:
Red Team
Orange Team
Yellow Team
Green Team
Blue Team
Pink Team
Grey Team
M1D5: PPIase assay
TR Section
Plate #1: linked here
Plate #2: linked here
WF Section
Plate #1: linked here
Plate #2: linked here
Plate #3: linked here
M1D6: DSF results
TR Section
First Derivative: linked here
Melt Curve: linked here
WF Section
First Derivative: linked here
Melt Curve: linked here
M1D7: Data analysis
| Team | PPIase results | DSF results |
| T/R | ||
| Red | DSF red | PPiase red |
| Orange | DSF orange | PPiase orange |
| Yellow | DSF yellow | PPiase yellow |
| Green | DSF green | PPiase green |
| Blue | DSF blue | PPiase blue |
| Pink | DSF pink | PPiase pink |
| Purple | DSF purple | PPiase purple |
| White | DSF white | PPiase white |
| Platinum | DSF platinum | PPiase platinum |
| W/F | ||
| Red | PPIase Red | DSF Red |
| Orange | PPIase Orange | DSF Orange |
| Yellow | PPiase Yellow | DSF Yellow |
| Green | PPIase Green | DSF Green |
| Blue | PPIase Blue | DSF Blue |
| Pink | PPIase Pink | DSF Pink |
| Grey | PPIase Grey | DSF Grey |
Module 2: Measuring gene expression
Heatmap with ALL genes for DLD-1 & BRCA2-/-: linked here
M2D9
qPCR results
| Team | qPCR Results | |
| T/R | ||
| Red | Sp19_qPCR_TRred | |
| Orange | Sp19_qPCR_TRorange | |
| Yellow | Sp19_qPCR_TRyellow | |
| Green | Sp19_qPCR_TRgreen | |
| Blue | Sp19_qPCR_TRblue | |
| Pink | Sp19_qPCR_TRpink | |
| Purple | Sp19_qPCR_TRpurple | |
| White | Sp19_qPCR_TRwhite | |
| Platinum | Sp19_qPCR_TRplatinum | |
| W/F | ||
| Red | Sp19_WFred_qPCR | |
| Orange | Sp19_WForange_qPCR | |
| Yellow | Sp19_WFyellow_qPCR | |
| Green | Sp19_WFgreen_qPCR | |
| Blue | Sp19_WFblue_qPCR | |
| Pink | Sp19_WFpink_qPCR | |
| Gray | Sp19_WFgrey_qPCR | |
| Experimental battery composition (AuNP/phage) | Weight of cathode (mg) | Actual capacity (mA*h/g) |
| 0 | 3.17 | 134.82 |
TR Battery information
| Team | Experimental battery composition (AuNP/phage) | Weight of cathode (mg) | Actual capacity (mA*h/g) |
| Red | 25 | 2.95 | 135.5932 |
| Orange | 10 | 2.77 | 113.18 |
| Yellow | 20 | 2.26 | 130.12 |
| Green | 25 | 2.83 | 113.271 |
| Blue | 20 | 1.98 | 103.63 |
| Pink | 10 | 2.06 | 128.19 |
| Purple | 33 | 3.46 | 106.40 |
| White | 31 | 2.89 | 89.313 |
| Platinum | 30 | 2.02 | 98.6432 |
WF Battery information
| Team | Experimental battery composition (AuNP/phage) | Weight of cathode (mg) | Actual capacity (mA*h/g) |
| Red | 35 | 3.4 | 43.519 |
| Orange | 25 | 1.29 | 119.8 |
| Yellow | 40 | 1.70 | 133.55 |
| Green | 25 | 2.52 | 109.6413874 |
| Blue | 30 | 1.87 | 88.43335 |
| Pink | 20 | 1.71 | 71.5833 |
| Grey | 14 | 3.33 | 99.2103 |