20.109(S17):Scan slides to identify FKBP12 binders (Day5)
Contents
Introduction
In the previous laboratory session you screened SMM slides using your purified FKBP12 protein. To identify which of the small molecules you screened bind FKBP12, your slides will be evaluated using a Genepix microarray scanner. The scanner will measure the fluorescence signal emitted from each spot on the slide where a ligand was printed. Considering that neither the ligands nor FKBP12 protein is fluorescent, from where does this signal arise?
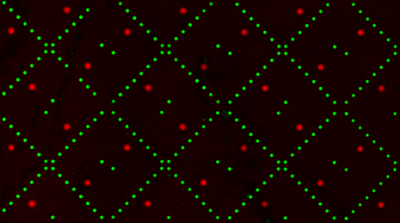
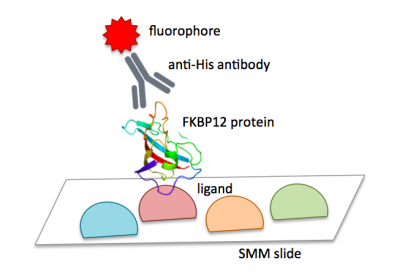
The image to the right is from a pilot experiment completed in preparation for this module. The green spots represent locations on the SMM slide where fluorescein was printed. Fluorescein is a fluorescent dye used for alignment purposes. A positive control was also included on each slide. You may remember that 4 x 48 spots were printed with rapamycin. Rapamycin is a macrolide compound used to suppress the immune system in organ transplant recipients. For our purposes, it is a compound known to bind FKBP12. In the image to the right, the bright red spots show where FKBP12 bound to the rapamycin. However, this still doesn't answer the question concerning the source of the red fluorescent signal. Think back to the purification procedure. A His tag was used to isolate FKBP12 from the cell lysate. This tag can also act as a target for antibody probes. The anti-His antibody that you added to your slides attached to the His-tagged FKBP12 protein that were bound to the slide (more specifically, the ligands that were linked to the slides). The anti-His antibody has two important features: it is able to bind a His tag and it is conjugated to a fluorophore. As shown in the image below, the ligand-protein-antibody complex results in a fluorophore only at sites where FKBP12 binding occurs on the slide.When the slide is imaged, the scanner exposes the SMM to excitation light specific to the fluorophores used in the experiment (i.e. wavelengths that excite fluorescein and the Alexa Fluor 647 attached to the anti-His antibody). The scanner then detects the intensity of the emitted fluorescence light.
Protocols
Part 1: Workshop with BE Communication Lab
Our communication instructor, Dr. Diana Chien, will join us today for a workshop on writing informative and concise abstracts.
Part 2: Scan slides
Rob will lead you through a demonstration on how to scan your SMM slides. You should take notes to ensure you know the purpose of each setting. An outline of the steps is included below for your reference.
- Place the slide in the scanner barcode side down.
- Set the desired wavelengths that you want to scan.
- For fluorescein: 532 nm
- For Alexa Fluor 647 (anti-His antibody): 635 nm
- Set the wavelength, filter, PMT, and power settings.
- Rob will discuss these features during the demonstration.
- Record the purpose for each of these settings in your laboratory notebook!
- Run a preview scan to optimize the PMT for the 635 nm (red) emission.
- Complete a full scan using the optimal PMT value.
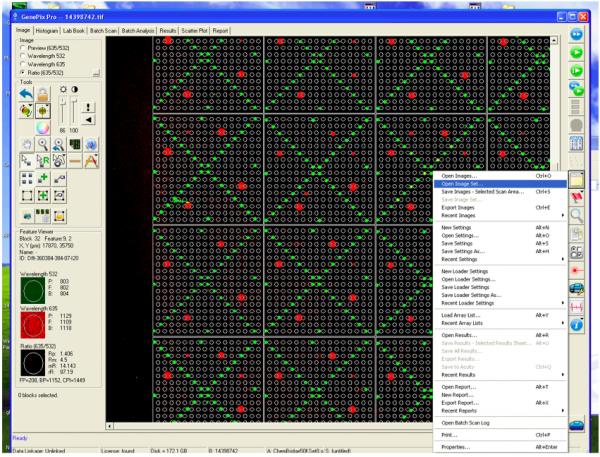
- Following the scan, you will see an image of your slide as below.
Part 3: Review journal article
Skim and discuss the journal article by Sadaghiani et al. titled "Identification of Orai1 channel inhibitors by using minimal functional domains to screen small molecule microarrays" with your laboratory partner during the downtime that you will have today.
The initial experiment in this publication was a SMM that identified inhibitors of store-operated calcium channels. This first step is very similar to your project in our module. To further assess the results of the SMM, Sadaghiani et al. completed several follow-up experiments. In your laboratory notebook, list the additional experiments that were reported and the conclusions of these experiments. You do not need to provide much detail here, just a sentence or two with what was done and what information/insight was gained. When you complete your list, consider how these experiments are connected such that the paper provides a complete and coherent story. What is the story?
Use this list to guide a discussion with your partner concerning the follow-up experiments that would be useful/insightful if you were to assess your hits for FKBP12. Keep in mind that not all of the approaches in the paper are relevant to your research and that not all of your experiments need to come from the paper. Rather the questions that you address in your experiments should work toward a complete and coherent story.
Reagents
- Genepix 4300 microarray scanner (Molecular Devices)
- Genepix Pro software (Molecular Devices)
Next day: Complete data analysis
Previous day: Screen chemical library for FKBP12 binders


