ThorLabs OTKB optical trapping kit
Contents
OTKB construction
Suggested modifications to OTKB layout
COMMENT: The use of reference designators would make this section clearer. If the ThorLabs manual does not include them in their documentation, I suggest adding them and here. This section should include specific changes in all cases: Use A, B, and C, instead of D, E, and F. It should also include a list of all changes to the bill of materials. (The list of changes should include all quantities, including screws and lengths.)
I suggest using the name of a component followed by the part number in parenthesis the first time a component is mentioned. In subsequent references, use whichever form is clearest. Do not invent names for the components (such as "cylinder" for "post"). Use the terminology from the catalog.
- Connect the fiberport to the right angle kinematic cage mount (KCB1) with 4 cage rods (ER05), instead of a lens tube. (Use a 30mm optical cage plate gasket CPG3 to fill the small gap.)
- Connect the KCB1 a 0.5" thick 30mm cage plate (CP02T) with 4 ER05 cage rods. Use a 0.3" SM1 lens tube (SM1L03) and an externally threaded tube coupler (SM1T2) to enclose the optical path.
- Use 3 8" cage rods (ER8) rods to connect the CP02T to the cage cube (C6W). Mount two 30mm cage plates (CP02) on the rods.
- COMMENT: I believe this is incorrect.
were mounted on CPB1 bases: the closest one to the KCB1 was attached to an SM1L05 lens tube that holds the first achromatic doublet lens (part number AC254-060-B) and the other is connected to two lens tubes used to enclose the beam (specific sizes will be given when we enclose the beam).
- COMMENT: Why did you use two lens tubes?SM1L03 lens tube connected to a SM1L10 lens tube was screwed into the KCB1. The SM1L05, that holds the second achromatic doublet (part number AC-254-150-B), attached to the C6W, was connected to these combined lens tubes via a 1 inch piece of plastic tubing.
- COMMENT: clarify thisThe vertical segment was changed. The top of the KCB1 that leads to the objective (the end opposite that mentioned in the previous step) now has a SM1L05 lens tube connected to a SM1L03 lens tube threaded into it. In addition, the SM1Z that originally held the objective was replaced by a CP02. This CP02 was mounted on the ER3 rods that were attached to the KCB1.
- COMMENT: this is not specificThe sample holder was changed
- The height of the stage was lowered.
- Mount the translating breadboard (TBB0606) to the breadboard with four 2" long, 1.5" diameter mounting posts (P2).
Suggested modifications not yet implemented
- Change beam expander design from Keplerian to Galilean. Change lens 3A to p/n ACN254-040-B; change lens 3B to p/n AC254-075-B.
- Add a second cage cube for fluorescence imaging or a position detection laser.
- Use a separate tube lens, f=200mm, placed between the dichroic (4) and the CCD (5), instead of between the objective (6) and the dichroic (4).
- Implement a fine X/Y and height adjustment on the condenser. (The current implementation makes it difficult to center the laser in the condenser.)
- Implement a way to retract the condenser (Loading samples with the condenser in place is difficult.)
- Add a collimating/focusing lens to the LED illuminator. (This will reduce the image of the LED in the video capture and possibly facilitate easier condenser height adjustment.)
Alignment procedure
Collimating the Fiber-port
COMMENT: The Thorlabs OTKB manual includes a procedure for this (as does the fiber port manual). As I mentioned previosly, reference documented procedures and indicated changes.
#Disconnect the fiberport from the KCB1 to which it is attached and face the fiberport so that the beam will project onto a far away surface.
- Make sure you have set up beam stops and removed all reflective objects from the path of the laser so that your beam is constrained to a straight path.
- Use an IR detector card to determine whether the beam is diverging or converging. Start with the card right at the orifice from which the laser emerges. Slowly move the IR card away from the fiberport and pay attention to the radius of the beam on the IR card. If the beam comes to a focus at a certain distance from the fiber-port, the beam is converging. Otherwise, it is diverging.
- Depending on your deduction from step 3, adjust the 3 plunge screws in identical amounts in the clockwise direction for a converging beam or counter clockwise for a diverging beam.
- Repeat steps 3-4 until you are confident in the collimation of your laser. If you have collimated your laser well, it should form a relatively small radius dot on the far away surface mentioned in step 1.
Aligning the Fiber-port
COMMENT: The Thorlabs OTKB manual includes a procedure for this (as does the fiber port manual). As I mentioned previosly, reference documented procedures and indicated changes.
#Attach 4 ER8 cage rods to the CP02 holding the fiber-port.
- Slide 2 CP02s onto the cage rods, positioning one halfway to the end of the rods and the other at the end of the rods. Tighten the CP02s so they can't slide around.
- Attach an SM1D12D ring iris to each CP02 and open them all the way.
- Close the iris closest to the fiber-port and using the x-y screws, adjust the beam so that it is going through the center of the iris.
- Open that iris and close the one furthest away from the fiber-port.
- Using the plunge screws on the fiber-port, adjust the beam so that it is going straight through the closed iris. Be very careful not to adjust the plunge screws too much, or you might affect your laser collimation.
- Repeat steps 4-6 until the beam goes through the center of both irises when they are closed.
- Remove the parts attached in steps 1-3.
Aligning the first KCB1
- Connect the CP02 holding the fiber-port to the first KCB1 using 4 ER05 rods.
- Repeat steps 1-3 from the "Aligning the Fiber-port" section instead connecting the ER8 cage rods to the opposite end of the KCB1 as the CP02 holding the fiber-port.
- Check your laser collimation using the same techniques mentioned in the "Collimating the Fiber-port" section and adjust the plunge screws accordingly to re-collimate your beam.
- Close the iris closest to the KCB1 and using the x-y screws on the fiber-port, adjust the beam so that it goes through the center of the closed iris.
- Open that iris and close the one furthest from the KCB1. Using the two tilt screws on the KCB1, adjust the beam so that it goes through the center of the closed iris.
- Repeat steps 4-5 until the beam goes through the center of both irises when they are closed.
- Remove the parts attached in step 2.
Aligning the First Dichroic and Second KCB1
COMMENT: The OKTB manual gives a procedure for this.
- Assemble the beam expander section (as documented in the "Modifications" section) such that the first KCB1 is connected to the C6W cage holding the first dichroic.
- Make sure your second achromatic doublet (f = 150mm) has been mounted in an SM1L05 and connected to the C6W such that it lies 90 degrees clockwise from the beam expander section.
- Check the collimation of your beam by adjusting the CP02 holding the first achromatic doublet (f = 60mm) and using the same techniques described in the "Collimating the Fiber-port" section. Once your beam is collimated, secure the CP02 holding the first achromatic doublet. Doing this step carefully will help you when adjusting the height of the condenser in later steps.
- Connect the C6W to the second KCB1 using the ER rods mentioned in the "Modifications" section.
- Repeat step 2 from the previous section.
- Close the iris closest to the KCB1 and rotate the dichroic and adjust the tilt screws on the dichroic mount in small increments to make the beam go through the center of the closed iris.
- Open that iris and close the iris furthest away from the KCB1. Using the 2 tilt screws on the KCB1, adjust the beam so that it shoots through the center of the closed iris.
- Repeat steps 6-7 until the beam goes through the center of both irises when they are closed. Note: this step is incredibly important to get accurate. The objective will magnify any error by 100x (dependent on the magnification provided by your objective), thus the closer you are to being aligned in this section, the easier it will be to align the trap when you have installed the objective and condenser.
- Remove the assembly installed in step 5
Collimating the Objective and Condenser
COMMENT: this does not match the procedure I used
- Install the objective and the rest of the vertical segment as mentioned in section 4.3 of the OTKB manual accounting for the changes in the "Modifications" section.
- Mount the condenser as described in section 4.4 step 1-3 of the OTKB manual, disregarding the recommended height.
- Tighten the C1500 clamp holding the condenser such that it doesn't freely slide along the DP14 but it can still be moved very small amounts either by hand or by being tapped by a blunt instrument such as the handle of a screwdriver.
- Turn the laser on, load a sample slide (prepared as instructed in section 3.5 of the [1] using immersion oil, and adjust the condenser height such that the beam is collimated using the same techniques mentioned in the "Collimating the Fiber-port" section. When properly collimated, the condenser will be very close to the objective (on the order of a few mm).
- Tighten the C1500 clamp holding the condenser completely.
Aligning the Second Dichroic
- Complete section 4.4 of the OTKB manual (incorporating all necessary changes from the "Modifications" section)
- Attach the assembly mentioned in step 5 from the "Aligning the First Dichroic and Second KCB1" section to the face of the C6W to which the QPD will eventually be attached.
- Close the iris closest to the C6W and rotate the mount for the second dichroic such that the beam goes through the center of the closed iris.
- Open that iris and close the one furthest from the C6W. Adjust the tilt screws on the dichroic mount such that the beam goes through the center of the closed iris.
- Repeat steps 3-4 until the beam goes through the center of both irises when they are closed.
QPD
Assuming you have accurately aligned your trap, the laser beam should shine on a quadrant of the QPD. Using the two screws on the HPT1 cage mount, adjust the beam such that it shines on the center of the QPD. Congratulations, you have now aligned your optical trap!
Comparison of OTKB and 20.309 optical trap operating characteristics
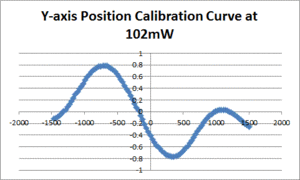
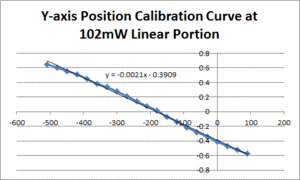
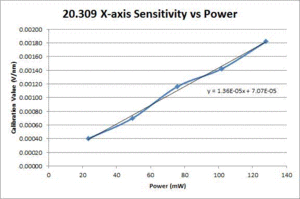
Position calibration
| ThorLabs OTKB | 20.309 | |
|---|---|---|
| X position | 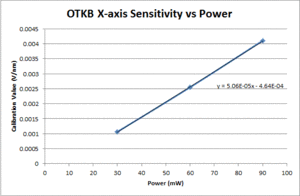
|
|
| Y position | TBD | 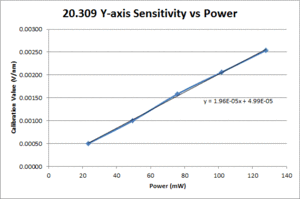
|
Methodology
- Prepare a sample cell per section 3.5 of the Optical Trapping Lab Manualand load it with stuck and suspended silica microspheres as per section 4.1.1.
- Trap a suspended microsphere and adjust the focus to place it near the middle vertically of the sample cell. (Crash the trapped bead into the cover-slip and then raise it about half of the height of the cell, which is about 100 microns.)
- Using QPD Alignment Tester, adjust the QPD position until the voltage output on both axes is near zero.
- Save an image of the trapped bead.
- Find a stuck bead.
- Adjust the focus so that the stuck bead looks similar to the saved image of the free trapped bead.
- Center the bead as per section 4.1.2. and run the Position Calibration VI. In the data file, the first row gives displacement from the starting position (in nm) and the second row gives the QPD signal for the axis being tested (in V).
- Fit a line to the approximately linear portion of the graph where the bead passes through the center of the trap. The slope of the line is the position sensitivity in V/nm.
- Repeat 5 times on 5 different stuck beads.
- Use the same procedure on the other axis
- Repeat the entire process at 5 power levels
- Compute the average sensitivity and standard deviation at each power level. Fit a line and plot to facilitate interpolation.
Materials
- 1μm silica microspheres, BangsLabs SS03N/4669
- 25x75mm glass slide
- 22x40mm #0 coverslip
- 1M NaCl
Comments
- Picomotor step size assumed to be 30nm. Using actual step size would increase accuracy of the position calibration.
- Estimated sensitivity is affected by focus.
Trap stiffness by equipartition method
Background
Some background for this method can be found in section 4.2.1 of the Optical Trapping Lab Manual. Assuming these experiments are being run at room temperature, the equation from the lab manual simplifies to: $ \alpha = \frac{4.1124*10^-21}{\left \langle \Delta x^2 \right \rangle} $. Thus, in order to solve for the trap stiffness, the variance in position is the only thing that needs to be calculated. Since this variance is measured in volts, position calibrations will be required in order to convert the voltage signal into a position in meters (note: since the calibration values from the previous section were in V/nm, you will need to convert these into V/m in order to solve for $ \alpha $). The next section will explain the procedure used to perform this force calibration.
Procedure
- Prepare a sample cell per section 3.5 of the Optical Trapping Lab Manualand load it with about 10 μ; of 1:50,000 10% wt stock beads (1 μm silica, Bangs, SS03N/4669).
- Load the slide onto the microscope and trap a bead.
- Raise the bead to the middle of the channel and move it away from any obstructions.
- Use QPD Alignment Tester VI to center the voltage signal.
- Open the WriteXYTraceToFile VI. Enter the Sampling rate in Hz and the sampling time in seconds (64000 Hz and 3 sec were used respectively). Press start. While the VI is running, verify that the bead leaves the trap and nothing else becomes trapped. Save the data.
- Use the Matlab to calculate the variance of the position data. The result will be in m2.
- Use the sensitivity determined from position calibration to convert to meters2.
- Use the equation mentioned in the background section to calculate the trap stiffness.
- Repeat the calibration 10 times at each of 5 power levels (make sure to use different beads!) and average the stiffness results obtained per power level.
- Plot measured trap stiffness versus the power level and fit a line to facilitate interpolation.
Results
| ThorLabs OTKB | 20.309 | |
|---|---|---|
| X and Y axes | TBD | 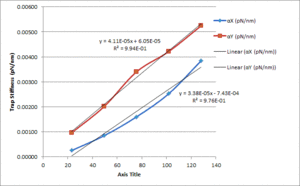
|
Trap stiffness by PSD rolloff method
Background
Some background for this method can be found in section 4.2.2 of the Optical Trapping Lab Manual. From the equations provided in the lab manual, we can solve for $ \alpha $ to be equal to: $ \alpha = 6\pi $2$ \eta $ d f0, which, plugging in for $ \eta $, $ \pi $, and d, we get that $ \alpha $ is directly proportional to f0, or the cutoff frequency, per the equation: $ \alpha $ = (5.27*10^-5)(f0), where $ \alpha $ is in pN/nm and f0 is in Hz. Below, the procedure for data collection and analysis as well as the matlab scripts used for the latter are written.
Procedure
- Load the collected waveform data from the equipartition stiffness calibrations for each trial into Matlab (i.e. data = load('filename');)
- Take a psd of the data, making use of the matlab command "pwelch" (i.e. datapsd = pwelch(data);)
- Create a frequency spectrum, f, that is based on the length of the psd by use of the matlab comand "linspace". If you sampled at 64kHz, you will want to type: f = linspace(1, 32000, 32769) where the inputs to the command "linspace" are the starting value, stopping value, and number of values respectively. Note: the sizes of f and the transpose of psd (i.e. psd') should be the same. If they aren't, you most likely entered the wrong values when creating f.
- Run the FitPSD(f, psd) Matlab function below to calculate the cut off frequency of the psd of the collected waveform data. Because of the 1/f noise that usually is present in the psd data, you may want to cut off the first 5-10 points when running this function (i.e. type FitPSD(f(10:end), psd(10:end)) to cut off the first 10 points). When you run the FitPSD function, it will return a 1x2 array. The number positioned at entry (1, 2) is the cutoff frequency. The function will also graph the raw PSD data as well as the nonlinear fit that it has attributed to the data. If the fit does not resemble the data well, cut off a few more of the beginning points. If it still doesn't fit the data, retake the data for that trial.
- Use the equation mentioned in the background section to calculate the trap stiffness, plugging in the cutoff frequency given by the matlab function mentioned in the previous step.
- Repeat for all collected data
- Plot measured trap stiffness versus the power level and fit a line to facilitate interpolation.
Analysis
Two matlab functions were used to analyze the waveform data collected. We made use of the matlab command "lsqcurvefit" to fit a nonlinear curve to our data based on the type of function which is documented in the lab manual referenced in the background portion of this section (for more information on how the matlab command "lsqcurvefit" works, check their documentation). The first matlab function is called "TransferFunc" and it takes two inputs: a 1x2 array called "params" and an array called "xdata". The two numbers in the array "params" are beta and the cutoff frequency (do not worry about the former). The second matlab function is called FitPSD and takes in two inputs: "f" and "psd", both of which you created in the previous section. The code for each of the functions is as follows (note, when saving each of these functions, make sure to save them as their function name as a .m file, so TransferFunc would be saved as TransferFunc.m. Otherwise, they will not work).:
TransferFunc.m:
function out = TransferFunc(params, xdata)
beta = params(1);
f0 = params(2);
out = params(1)./(params(2).^2 + xdata.^2);
FitPsd.m:
function out = FitPsd(f, psd)
out = lsqcurvefit(@TransferFunc, [1, 100], f, psd');
figure
loglog(f, psd)
hold on
loglog(f, TransferFunc(out, f), 'r');
Results
| ThorLabs OTKB | 20.309 | |
|---|---|---|
| X-axis Trap Stiffness | 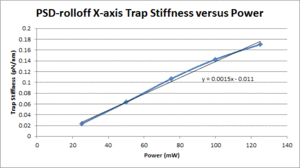
|
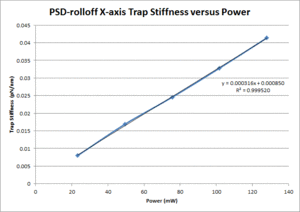
|
| Y-axis Trap Stiffness | TBD | TBD |
DNA Tether Assay
Introduction
The purpose of performing this assay was to use a simple biological measurement to compare the data obtained from the OTKB trap to the 20.309 trap as well as several documented results. Information regarding this assay can be found in [1] and section V of [2].
Materials
- PBST
- PBS
- Casein
- Acrodisc Syringe Filter 0.2$ \mu $m HT Tuffryn Membrane
- BD 10ml Syringe
- Etched Coverslip
- Microscope Slide
- 1$ \mu $m diameter polyscience streptavin coated silica beads
- 50$ \mu $g/mL solution of anti-dig antibodies
- 1ng/$ \mu $L dilution of 3500 base pair DNA (for more information on production, read part B of the second source provided in the Introduction section)
Procedure
The procedure was similar to references [1] and [2].
- Create a solution of 1mg/mL casein using PBST as the solvent. This solution should be remade daily. Casein is difficult to disolve, thus thinly spreading the measured casein along the inner wall of the centrifuge tube you are using to make the solution would be advantageous.
- Using the syringe and filter, filter the casein solution into a new centrifuge tube.
- Create a slide per the aforementioned method. Be sure to use an etched coverslip!
- Load 40$ \mu $L of the anti-dig solution onto the slide and let incubate coverslip down for 40 minutes.
- Pipet 5$ \mu $L of the streptavin coated silica beads into a microfuge tube.
- Add approximately 170$ \mu $L of PBST to the tube. Pipet up and down to suspend the beads
- Centrifuge the tube for 5 minutes at 10 rcf (10,000 rpm)
- Remove the tube from the centrifuge. You should notice a small pellet of beads at the bottom of the microfuge tube. Using a pipeter, remove the PBST from the microfuge tube being very careful as to not remove any beads.
- Repeat steps 6-8 two more times.
- Add 100$ \mu $L of the filtered casein solution to the microfuge tube holding the bead pellet, and pipet up and down to suspend the beads
- Vacuum 40$ \mu $L of the filtered casein solution into the slide channel and let sit for 30 minutes.
- Vacuum 40$ \mu $L of the DNA dilution into the slide channel and let sit for 30 minutes.
- Using a probe sonicator, sonicate the bead solution finished in step 10 for 2 minutes at a power level of 0.5W
- Vacuum 30$ \mu $L of the sonicated bead solution into the slide channel and let sit for 30 minutes
- Flow 50$ \mu $L of casein through the slide twice to rinse it out.
- Seal slide with vacuum grease or nail polish
References
- ↑ 1.0 1.1 Wang, et. al. Stretching DNA with Optical Tweezers. Biophysical Journal Volume 72 March 1997 1335-1346
- ↑ 2.0 2.1 Appleyard, et. al. Optical trapping for undergraduatesOptical trapping for undergraduates. Am. J. Phys., Vol. 75, No. 1, January 2007
