Difference between revisions of "Spring 11:Chemotaxis Assay"
| Line 16: | Line 16: | ||
=== Readings and Resources === | === Readings and Resources === | ||
| − | * [[Image: | + | * [[Image: Seymour 2008 Microinjector.pdf]] |
=== Materials and budget === | === Materials and budget === | ||
Revision as of 19:08, 17 May 2011
By: Emmanuel Quiroz
Contents
Introduction
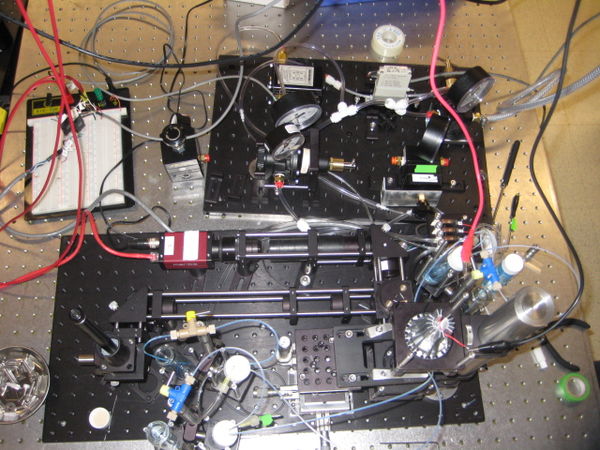
For my project I designed and developed an automated microfluidic system using Seymour et al’s microinjector microfluidic device to provide a high through-put method of acquiring bacterial chemotaxis parameters. The microinjector device was chosen for its simple design, diverse application to both fluid-flow and flow-free approaches, and for its ability to measure individual cell kinetics. The development of a faster and systematic device is especially useful in the research of marine microbes’ response to settling dissolved organic matter.
Objective
Further develop Stocker’s microfluidic system that will allow researchers to run chemotaxis assays more efficiently for high though-put assays. The main improvement to Stocker's system will be the use of pneumatic pressures instead of syringe fluid pressures to control fluid flow to set up the chemoatractant and microorganism bands. The pneumatic pressure will be computer controlled to to allow precise and reproducible experiments as well as increased experimental throughput.
Spring 20.345 Project Assignments
Readings and Resources
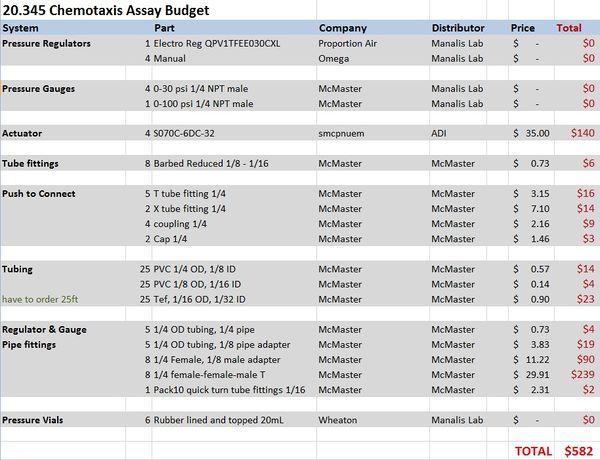
Materials and budget
- DAQ card NI-USB 6212
- Microinjector Microfluidic device from Stocker lab
Microinjector Microfluidic Device
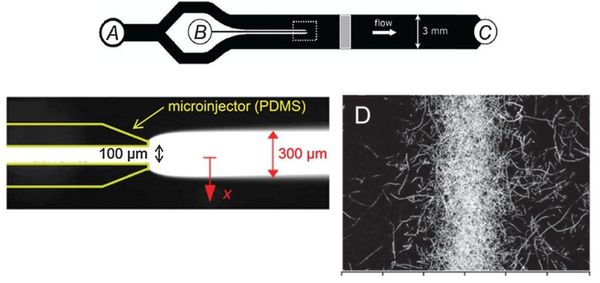
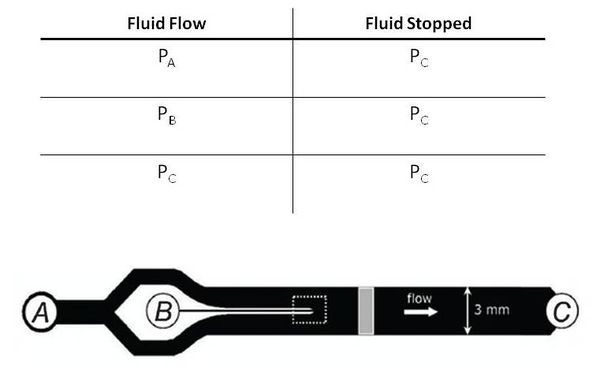
Flow-free, or ‘stopped-flow’, chemotaxis assays allow for the analysis of individual bacterial movement in the absence of shear forces and relies on natural diffusion to generate a gradient. In this approach, fluid flow is only used to set up an initial gradient, but is stopped, allowing the gradient to evolve by diffusion alone. These devices produce unsteady gradients that are advantageous in representing environmental conditions of nutrients especially in marine bacteria and in characterizing bacterial responses to wide range of concentration and gradients within a single experiement. The bacterial distribution is measured by recording the kinetic paths of individual bacteria using videomicroscopy. An example of this approach is Seymour et al’s microinjector microfluidic device
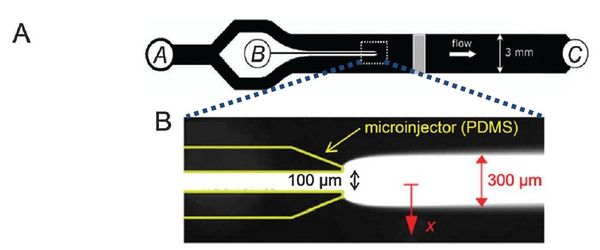
Dimmension
- Microinjector Channel
- width: 100μm
- depth: 50μm
- length:
- Main Channel
- width: 3mm
- depth: 50μm
- length:
Microscope
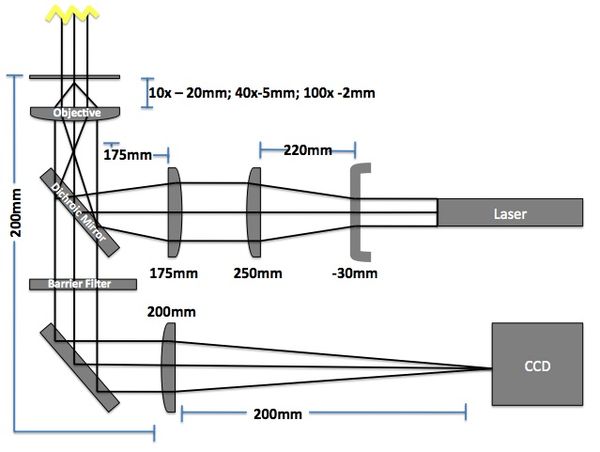
The imaging microscope will be a brightfield and fluorescent microscope as shown in Fig 3. A CCD camera will acquire images at a given rate and the kinetic paths will be tracked using particle tracking algorithms.
- Camera (Allied Manta G032B): 7.4μm sqr pixels, 656 x 492 pixels
- Field of View: 484μm x 366μm (10x objective w/200mm lens => 10x magnification)
- Red LED illumination
Pneumatic System Design
The pneumatic system is composed of manual and electro forward pressure regulators, solenoid actuators, pneumatic tubing, and circuitry to
Basic Design
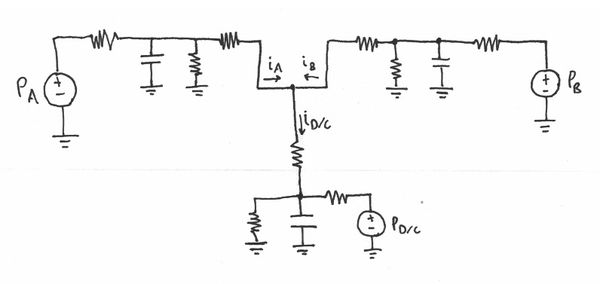
The fundamental principle behind this system is that changes in pressures causes fluid flow and when the pressure equalize to the same 'ground' pressure, fluid flow should stop. By this approach one is able to easily control fluid flow of the entire channel and the flow rates into inlets A and B to control the width of the chemoeffector band, dependent on the ratio of $ P_{A} $ and $ P_{B} $. Solenoid actuators, controlled by LabView, to switch from the 'flow' pressure state to the 'stopped' state.
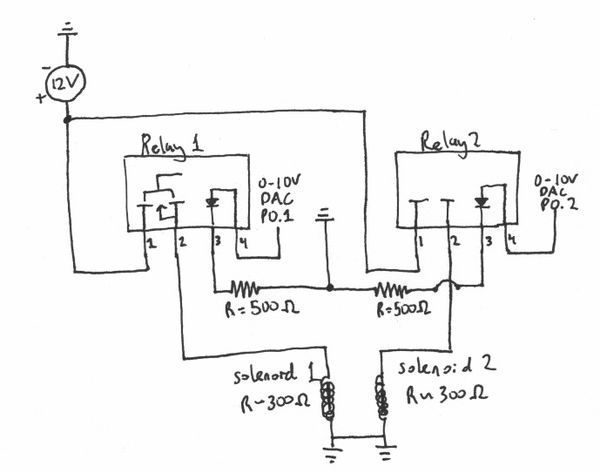
Solenoid Actuators
Power Relay Specs
Clare CPC1709J Power Relay
- Ports
1.) (+) 12 V (Voltage output to solenoid) 2.) (-) out 3.) (-) ground 4.) (+) 2.4 DAQ-VDC (trigger)
- needs 12V-DC
- impedance of ~300 Ohm
- 0.04 Amps
Electro Pressure Regulator
Proportion Air QPV1TFEE030CXL
- 15-24 V, 0.1 - 0.35 Amps
Specs
Circuit Element Design
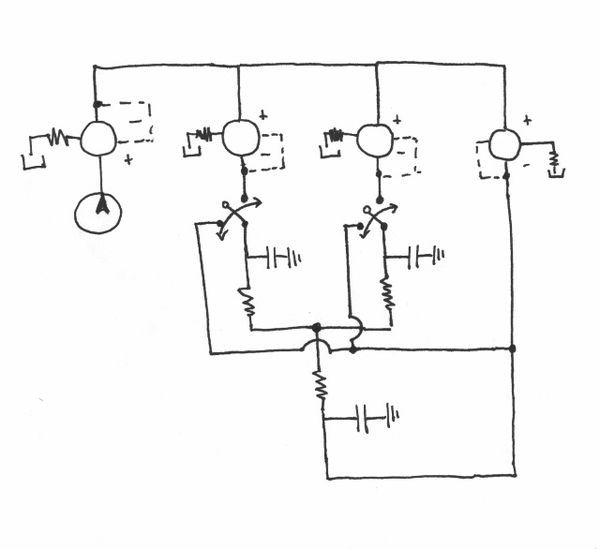
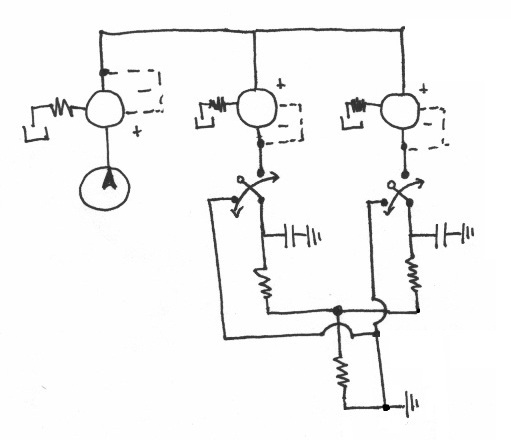
In order to understand the system, I modeled it as a lumped circuit elements model (Interdisciplinary Electrical Analogies). All of the pressure potentials are measured relative to atmospheric (atm = 0 psi). The pressurized wheaton vials act as capacitors. Fluid resistance depends on pressure drop and inversely to fluid flow rate. So for example as a channel decreases in cross sectional area then flow rate decrease, therefore resistance increases (flow rate also dependent of viscosity and density of fluid). The current of the system is flow rate. The following defines the elements more specifically:
- Flow/Current: Volume (fluid) flow, $ G \left[m^{3}\cdot s^{-1}\right] $
- Potential: Pressure drop, $ P \left[psi\right] $
- Integrating Element: Inertance, $ M $
- $ G = \frac{1}{M} \int \rho {\mathrm{d} t} $
- e.g., for pipe: $ M = \rho*\frac{L}{A} $
- Fluid resistance: $ R \left[m^3\cdot s^{-1}\cdot psi^{-1}\right] $
- $ R = \frac{G}{P} $
- Fluid capacitance: $ C, \left[m^{3}\cdot psi^{-1}\right] $
- $ G = C*\frac{\mathrm{d} P}{\mathrm{d} t} $
Design 1
The first design attempted to place the 'ground' pressure around $ P_{C} = 10psi $ and then have upstream pressures around $ P_{A} = P_{B} = 15psi $. This was done to avoid any inconstancies of working at atmospheric pressure.
Design Problems
- Needed to bring system pressures to atm when replacing samples
- solution: add solenoid switch to easily bring system to atm
Design 2
The second design attempted to place the 'ground' pressure $ P_{C} = 0 psi $ or atm and then have upstream pressures around $ P_{A} = P_{B} = 2 psi $.
Design 3
Overall Design Problems
- Hydrostatic flow due to changes in reservoir volumes and reservoir height. This was a major problem with the system. The most difficult aspect of this problem is that as sample fluid flows then reservoir heights change and affect hydrostatic flow during experimental set up.
- solution: placed reservoir samples on height adjustable stages. This still does not address the problem of reservoir volumes and heights changing during fluid flow and experimental set up. To reduce this change during fluid flow is to use reservoirs with a larger surface area, or basin.
Experiment 1:
LabView Calibrations
Weekly Reports
- By Emmanuel Quiroz
