Optical detectors, noise, and the limit of detection
Noise sources in optical detectors
The maximum information you can extract from an image is limited by its signal-to-noise ratio (SNR). With signal defined as the amount of light incident upon the detector per unit time, noise can be seen as the “disturbance” on the signal level that hinders an accurate measurement.
Examining the sources of noise in your optical detector, both fundamental and technical, and understanding which contributions have the greatest impact on the uncertainty of your measurement, will be central to optimizing the quality of your results and conclusions.
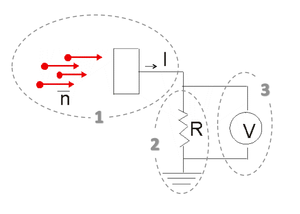
- Detection of light can be decomposed in three simplified steps:
- conversion of light to free electrical charge-carriers
- conversion of current to voltage
- measurement of voltage .
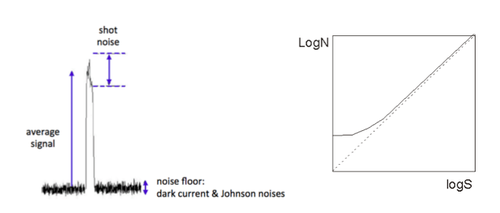
- Optical detectors are subjected to
- Optical shot noise (Ns): inherent noise in counting a finite number of photons per unit time
- Dark current noise (Nd): thermally induced “firing” of the detector
- Johnson noise (NJ): thermally induced current fluctuation in the load resistor
- Technical noise and 1/f noise due to various imperfections (for instance spike at 120 Hz from electrical outlets or from fluorescent room light).
Poisson shot noise
As photons are emitted independently of each other, the events of photon arrival at the detector are statistically independent, or “uncorrelated”. Although the mean number of photons $ \bar n $ arriving per unit time is constant on average, at each measurement time interval t, the number of detected photons does vary.
- The statistical fluctuation of uncorrelated random events obey Poisson statistics:
- the probability of observing n photons is:
- $ P (n| \bar n)= e^{-n} {{\bar n}^n \over {n!}} $
| Poisson statistics of uncorrelated events | |||
| Distribution of uncorrelated events of mean $ \bar n $ varying from 1 to 20: | |||
| mean: $ \bar n = {1 \over M} \sum_1^M {n_i} $ | variance: $ \sigma_n^2 = {1 \over M} \sum_1^M {{(n_i - \bar n)}^2} $ | standard deviation: $ \sigma_n = \sqrt {\bar n} $ | |
- The shot noise in photon count (on $ \bar n $) results in shot noise in electrical current (on I ):
- $ \left \langle I_{signal} \right \rangle = \eta q \bar n / \Delta t $
- where $ \bar n $ is the number of photons incident, $ \Delta t $ is the acquisition time, q is the charge of an electron (q = 1.6 x 10$ ^{-19} $ C), and η is the quantum efficiency of the detector.
- hence $ \left \langle I_{noise} \right \rangle = \eta q \sqrt {\bar n} / \Delta t $
- or $ \left \langle I_{noise}^2 \right \rangle = {\left ( \eta q / \Delta t \right )}^2 \bar n $
- and $ \left \langle I_{noise}^2 \right \rangle = \left ( \eta q / \Delta t \right ) \left \langle I_{signal} \right \rangle $
- Now introducing four important definitions:
- Signal power: $ S = \left \langle I_{signal}^2 \right \rangle R $,
- Noise power: $ N = \left \langle I_{noise}^2 \right \rangle R $,
- Signal-to-noise ration SNR: $ S = Signal Power / Noise Power = S / N $,
- Noise equivalent power NEP: signal power at which SNR = 1,
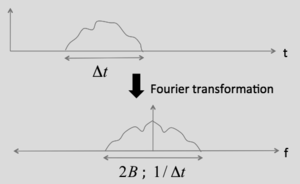
- we obtain an expression for the shot noise Ns in Fourier space $ N_s = \left \langle I_{noise}^2 \right \rangle R = 2 R \eta q B \left \langle I_{signal} \right \rangle $
- with 2B the bandwidth (in hertz) over which the noise is considered.
Relating current $ I $ to optical power P
- Calling P the optical power
- $ P = \bar n \left ( {{hc \over \lambda}}\right )/ \Delta t $
- and remembering $ \left \langle I \right \rangle = \eta q \bar n / \Delta t $
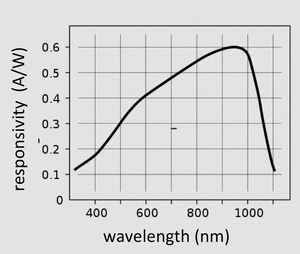
- one derives the detector's responsivity indicated in spec sheets
- $ {I \over P} = {\eta q \lambda \over hc} $
- Besides, with $ {\left ( {S \over N} \right )}_{current} = {\left \langle I_{signal} \right \rangle \over \sqrt {\left \langle I_{noise}^2 \right \rangle }} $ and $ \left \langle I_{noise}^2 \right \rangle R = 2 \eta q B \left \langle I_{signal} \right \rangle $,
- we obtain $ {\left ( {S \over N} \right )}_{current} = {\sqrt {\left \langle I_{signal} \right \rangle \over 2 \eta q B}} = {\sqrt {P \lambda \over 2 h c B}} $
- and $ {\left ( {S \over N} \right )}_{power} = {P \lambda \over 2 h c B} = \bar n $
Dark current noise
- The ideal photoelectric or photovoltaic device does not produce current (electrons) in the absence of light. However, thermal effect results in some probability of spontaneous production of free electrons. This effect is measured by the dark current amplitude of the device: $ \left \langle I_d \right \rangle $.
- The average dark current is constant at constant temperature, and it can be subtracted from the signal, but the electron generated fluctuate in time according to Poisson statistics, similar to the fluctuation of the signal photons. From our discussion of photon shot noise, we have readily:
- $ N_d = 2 R \eta q B \left \langle I_d \right \rangle $
Johnson noise
- Johnson noise originates from the temperature dependent fluctuation in the load resistance R of the transimpedance detection circuit.
- Consider a simple dimensional analysis:
- thermal energy: $ k_B T/2 $
- thermal power: $ N_J = {k_B T/ {2 \Delta t}} = k_B TB $
- and since the power of Johnson the noise current is expressed also as $ \left \langle I_J^2 \right \rangle R $
- $ I_J = \sqrt {{k_B TB \over R}} $
Compounding sources of noise
- Uncorrelated sources of noise N
- $ \lim_{T \to {+ \infty}} {{1 \over T} \int_{-T/2}^{T/2} (n(t+\tau) - \bar{n})(n(t) - \bar{n})^*\, d\tau} = \left \langle \Delta {n(t+\tau)} \Delta {n^* (t)} \right \rangle = 0 $
- (with $ \tau \ne 0 $ and * denoting the complex conjugate)
- will add in quadrature:
- $ N^2 \propto N_s^2 + N_d^2 + N_J^2 $


