Nonlinear regression
… the safe use of regression requires a good deal of thought and a good dose of skepticism
Review of linear regression
Linear Regression is a method for finding the magnitude of the relationship between two variables that co-vary. The technique assumes that a straight line characterizes the relationship between the two quantities: 𝑦=𝛽𝑥+𝛼, where 𝛽 is the true slope and 𝛼 is the true intercept. Some examples of physical systems that are modeled well by lines include resistors (V=IR) and springs (F=kx).
A simple way to find α and β is to measure the y at two different values of x, giving the datapoints (xi, yi); i = {1,2}. If the two points are precisely known, solving for the exact values of 𝛼 and 𝛽 is trivial. Unfortunately, all physical measurements include noise. The presence of noise precludes finding the exact values of 𝛼 and 𝛽.
Measurement noise can be modeled by adding a noise term, εi, to the right side of the model equation: yi=Βix+α+εix. The function of linear regression is to produce estimates of 𝛼 and 𝛽, denoted by α̂ and β̂, from a sample of N value pairs (xi, yi); i = {1, ..., N} that includes noise in the y-values. The most common regression model assumes that x is known exactly. In practice, regression works well if the relative magnitude of noise in x is much smaller than y.
The most common type of LR minimizes the value of the squared vertical distances between observed and predicted values
Model :
Assumptions:
the independent variable 𝑥 is known with certainty (or at least very much less error than 𝑦)
𝜀 is an independent, random variable with 𝜇=0
The distribution of 𝜀 is symmetric around the origin
the likelihood of large errors is less than small ones
Uncertainty in slope estimate
The error in slope 𝑊=𝛽 ̂−𝛽
Variance of 𝑊 characterizes slope error
You can calculate a 95% (or other significance level) confidence interval for 𝛽 ̂
What factors should the uncertainty depend on?
Estimate 𝜎^2 (𝑊): 𝑉^2 (𝑊)=(∑▒〖𝑟_𝑖^ 〗^2 )/((𝑁−2)∑▒〖(𝑥_𝑖−𝑥 ̅)〗^2 )
N-2 is a “penalty” because regression line minimizes variance of residuals
If the interval contains 0, the null hypothesis that 𝛽=0 cannot be rejected
Step 1: PLOT THE DATA
Examine the residuals
- plot 'em for an informal look
- various tests of residuals exist
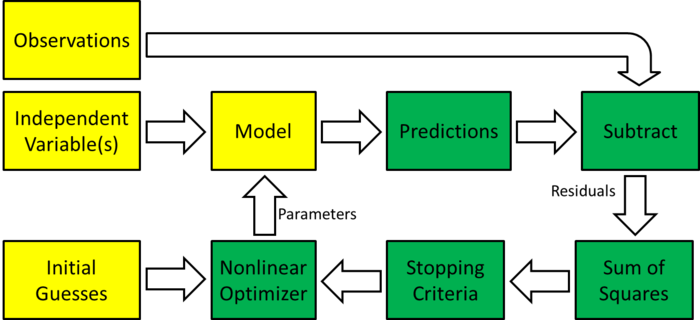
Overview of nonlinear regression
| Block diagram of nonlinear regression |

