Difference between revisions of "Matlab:Image Processing for Fluorescent Microscopy"
(Created page with 'category:Matlab category:DNA Melting Lab <div style="padding: 10px; width: 774px; border: 3px solid #000000;"> [[Image:FlatFieldCorrection.jpg|350 px|Steps In Overlaying…') |
|||
| Line 2: | Line 2: | ||
[[category:DNA Melting Lab]] | [[category:DNA Melting Lab]] | ||
<div style="padding: 10px; width: 774px; border: 3px solid #000000;"> | <div style="padding: 10px; width: 774px; border: 3px solid #000000;"> | ||
| + | ==Getting started== | ||
| + | ===Help=== | ||
| + | The most important command in Matlab is: <code>doc</code>. For example, type <code>doc imread</code> to get the documentation for the <code>imread</code> command. | ||
| + | === Loading images=== | ||
| + | Use the <code>imread</code> command to read an image file. | ||
| + | ===Image representations=== | ||
| + | Matlab supports several image representations. Although all images are contained in arrays, the dimensionality, range of pixel values, and data type vary among the different formats. | ||
| + | Monochrome intensity images are represented as a two-dimensional array of MxN pixel values, where M and N are the vertical and horizontal resolution. If the source image file is a monochrome bitmap, the output of <code>imread</code> will be an array of type uint8. Uint8 variables can hold integer values between 0 and 255. This limited range is not appropriate for many manipulations (like inversion, for example). A uint8 image can be converted to double precision floating point with the <code>im2double</code> command. The range of pixel values in a double precision image is from 0 to 1. Unsigned 16-bit and single precision floating point formats are also supported. (Matlab documentation uses the term "grayscale" instead of monochrome.) | ||
| + | Color images in Matlab are represented as three dimensional arrays of size MxNx3. The color image comprises three intensity images — one for each primary color red, green, and blue. As with monochrome images, the data type may be uint8, uint16, single, or double. | ||
| + | In indexed color images, each pixel value represents on color from among a palette of predefined colors. An indexed color image requires both an MxN array of pixel values and an Lx3 matrix that serves as a palette or colormap. The colormap contains triplets of values between zero and one, where each number in the triplet specifies the contribution of a primary color (in the order red, green, blue). The length of the colormap, L, depends on the image format. For example, the colormap for a uint8 image has 256x3 entries. The color [0 1 0] is pure green. [0.5 0.5 0] is a mixture of equal parts red and green at half their full intensity<ref>Sort of. See lecture slides on image intensity.</ref>. | ||
| + | There are myriad functions built into the image processing toolbox for converting among the formats. See, for example, <code>im2uint8</code>, <code>im2double</code>, <code>im2uint8</code>, <code>ind2RGB</code>, and the image processing toolbox documentation. | ||
| + | Matlab also supports High Dynamic Range (HDR) images, which are a topic for another day. | ||
| + | ===Displaying images=== | ||
| + | <code>imshow</code>, <code>image</code>, and <code>imagesc</code> are all useful commands. They behave slightly differently. I have no idea why Mathworks decided to write a bunch of similar functions instead of one good one with options. | ||
| + | Also, check out the <code>montage</code> command. | ||
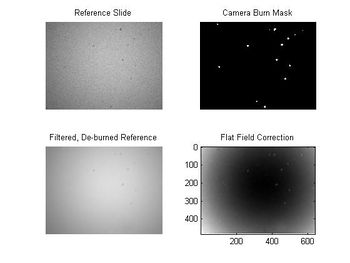
[[Image:FlatFieldCorrection.jpg|350 px|Steps In Overlaying Segmented Fluorescent Image]] | [[Image:FlatFieldCorrection.jpg|350 px|Steps In Overlaying Segmented Fluorescent Image]] | ||
| + | |||
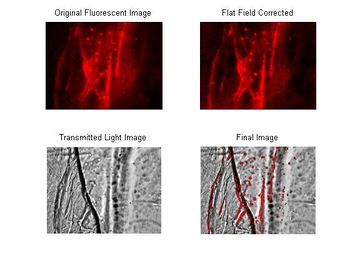
[[Image:OnionOverlaySteps.jpg|350 px|Steps In Overlaying Segmented Fluorescent Image]] | [[Image:OnionOverlaySteps.jpg|350 px|Steps In Overlaying Segmented Fluorescent Image]] | ||
| + | |||
</div> | </div> | ||
Revision as of 20:19, 13 October 2009
Contents
Getting started
Help
The most important command in Matlab is: doc. For example, type doc imread to get the documentation for the imread command.
Loading images
Use the imread command to read an image file.
Image representations
Matlab supports several image representations. Although all images are contained in arrays, the dimensionality, range of pixel values, and data type vary among the different formats.
Monochrome intensity images are represented as a two-dimensional array of MxN pixel values, where M and N are the vertical and horizontal resolution. If the source image file is a monochrome bitmap, the output of imread will be an array of type uint8. Uint8 variables can hold integer values between 0 and 255. This limited range is not appropriate for many manipulations (like inversion, for example). A uint8 image can be converted to double precision floating point with the im2double command. The range of pixel values in a double precision image is from 0 to 1. Unsigned 16-bit and single precision floating point formats are also supported. (Matlab documentation uses the term "grayscale" instead of monochrome.)
Color images in Matlab are represented as three dimensional arrays of size MxNx3. The color image comprises three intensity images — one for each primary color red, green, and blue. As with monochrome images, the data type may be uint8, uint16, single, or double.
In indexed color images, each pixel value represents on color from among a palette of predefined colors. An indexed color image requires both an MxN array of pixel values and an Lx3 matrix that serves as a palette or colormap. The colormap contains triplets of values between zero and one, where each number in the triplet specifies the contribution of a primary color (in the order red, green, blue). The length of the colormap, L, depends on the image format. For example, the colormap for a uint8 image has 256x3 entries. The color [0 1 0] is pure green. [0.5 0.5 0] is a mixture of equal parts red and green at half their full intensity[1].
There are myriad functions built into the image processing toolbox for converting among the formats. See, for example, im2uint8, im2double, im2uint8, ind2RGB, and the image processing toolbox documentation.
Matlab also supports High Dynamic Range (HDR) images, which are a topic for another day.
Displaying images
imshow, image, and imagesc are all useful commands. They behave slightly differently. I have no idea why Mathworks decided to write a bunch of similar functions instead of one good one with options.
Also, check out the montage command.
Cite error: <ref> tags exist, but no <references/> tag was found

