Difference between revisions of "File:Centering curve x axis.jpg"
From Course Wiki
(uploaded a new version of "File:Centering curve x axis.jpg": Red lines show the demarcation of the region in which we want to scan the DNA-tethered bead so that the bead does not fall out of the trap. The blue lines show a typical QPD vs. Pi) |
|
(No difference)
| |
Latest revision as of 07:38, 7 March 2012
File history
Click on a date/time to view the file as it appeared at that time.
| Date/Time | Thumbnail | Dimensions | User | Comment | |
|---|---|---|---|---|---|
| current | 07:38, 7 March 2012 | 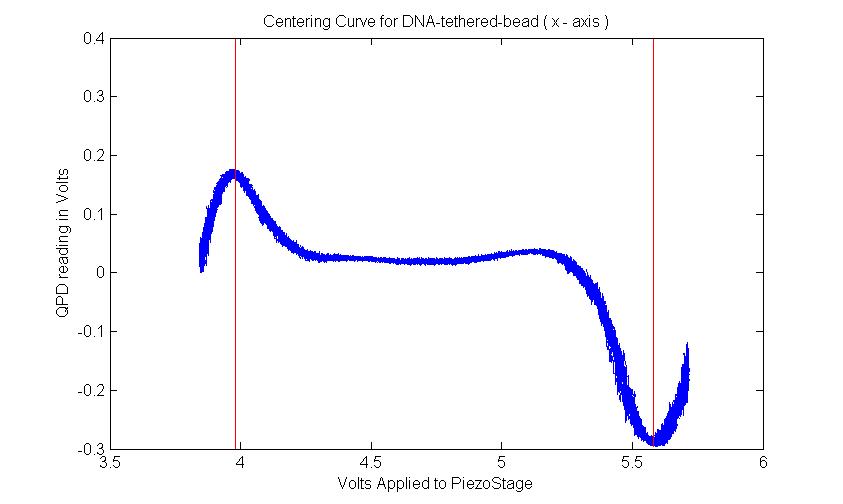 | 843 × 504 (32 KB) | Ajoke Williams (Talk | contribs) | Red lines show the demarcation of the region in which we want to scan the DNA-tethered bead so that the bead does not fall out of the trap. The blue lines show a typical QPD vs. PiezoVoltage reading for a DNA-tether-bead centering run. |
| 07:34, 7 March 2012 |  | 843 × 504 (32 KB) | Ajoke Williams (Talk | contribs) |
- You cannot overwrite this file.
File usage
The following page links to this file: