Difference between revisions of "Electronics Mini-Lab"
Steven Nagle (Talk | contribs) (→Part 2:making and characterizing a filter circuit) |
Steven Nagle (Talk | contribs) (→Measure voltages with the DMM) |
||
| Line 99: | Line 99: | ||
#'''Record the resistance shown on the DMM.''' | #'''Record the resistance shown on the DMM.''' | ||
#'''Record the uncertainty of the measurement.''' | #'''Record the uncertainty of the measurement.''' | ||
| − | #''' | + | #'''Calculate the change in the measured resistance if the DMM input impedance were 1 kΩ''' |
===Measure current with the DMM=== | ===Measure current with the DMM=== | ||
Revision as of 15:43, 8 August 2013
Overview
During the next lab exercise on measuring DNA melting curves, you will build and debug several electronic circuits. This mini-lab will introduce you to the electronic components and test equipment you will use. A short answer-book style writeup is required. Items to include in your report are shown below in bold.
This mini-lab requires an understanding of basic circuits. If you need to review circuit concepts, start with the Electronics Primer page. If you have a lot of experience with electronics, ask one of the instructors about doing a stimulating mini-project instead of the mini-lab assignment.
Part 1:making and characterizing a resistive voltage divider circuit
In part 1 of the mini-lab, you will analyze and build a voltage divider. The divider circuit comprises two resistors and a voltage source, as shown in the schematic diagram. You will select the values for R1 and R2. Choose any resistor values you like, but there are a few practical constraints.
The resistors in the lab range in value from 1Ω to 10MΩ. Within that range, manufacturers only produce certain standard values. Check the supply bins or this table to see which values are available.
Power dissipation in resistors increases as the square of current, P=I2R. The maximum power rating of the resistors in the lab is 1/4 Watt. Components operated at too high a power level may get very hot and fail. A noxious puff of smoke frequently accompanies failure. Even if a component operated at an excessive power level does not completely fail, its behavior will be unpredictable. Ensure that the power dissipated by R1 and R2 does not exceed the maximum rating.
You will use an oscilloscope to measure voltages in the circuit. The oscilloscope has an input impedance 1MΩ. Connecting the oscilloscope probe to a node of the circuit is equivalent to placing a 1MΩ resistor between that node and ground. In circuits that use very large resistors, the current flowing into the oscilloscope can significantly distort measurements.
Before building the divider circuit:
- Record the resistor values you selected and the gain of circuit, Vout / Vin.
- Plot an I-V curve showing I on the horizontal axis and Vin on the vertical axis over the range -15V < Vin < 15V.
- Derive a formula for the power dissipated in R1 and R2 as a function of Vin.
- Derive a formula for the change in Vo if a 1MΩ resistor is added in parallel to R2. Show the equivalent circuit and your derivation.
Build the circuit
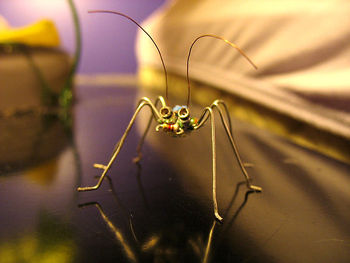
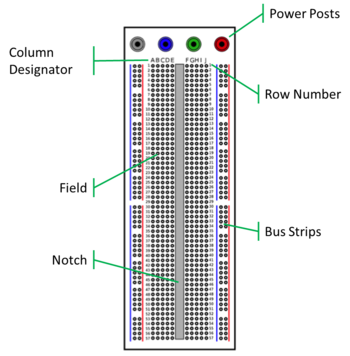
Most electronic components look like bugs. They have a central body with a bunch of gangly legs sticking out, called leads. The leads carry current from the outside of a component to its innards. One of the first challenges facing an aspiring circuit maker is to properly connect all the bugs' legs whilst keeping the circuit robust and orderly. Solderless electronic breadboards are a convenient platform for building circuits that might require a lot of debugging or frequent reconfiguration. Breadboards have a large number of square holes in them called tie points. A single wire or component lead fits into each tie point. Spring-loaded contacts inside each tie point hold the leads in place and provide an electrical connection. The images below show examples of solderless electronic breadboards.
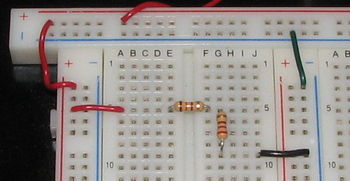
| Top view of a solderless electronic breadboard. | Voltage divider circuit implemented on a breadboard. |
Sets of tie points are electrically connected in a pattern that allows component leads to be connected in almost any arrangement. The two central grids of tie points separated by a notch are called the field. Each row of tie points in the field is called a terminal strip. The terminal strips are numbered. Columns are designated by a letter. Within a terminal strip, the five tie points A-E are connected, and tie points F-J are connected. Points A-E are not connected to points F-J. Connections between component leads are made by running jump wires between tie points that are connected to each lead, as shown in the image above on the right.
The lines of tie points to the left, right, and above the field are called bus strips. Bus strips are highlighted by red and blue lines. All of the tie points in a bus strip are connected together. Because most circuits have a lot of power and ground connections, the bus strips are almost always connected to the power supply. Using the bus strips as a power distribution network makes it easy to connect any terminal strip to power or ground with a short jump wire.
- Gather components to build the divider circuit:
- solderless electronic breadboard
- lab station with a working power supply and digital multimeter (DMM)
- jump wires, or a few lengths of different colored wire (located near the breadboards)
- wire strippers (located in your lab station drawer)
- banana cables (located on the West wall)
- resistors of the selected values (located on the bench at the North wall)
- Verify the value of the resistors by reading the coded bands.
- Through negligence or malice of last semester's scholars, components occasionally end up in the wrong bin. Instructions for reading resistor markings are available at this website.
- Mount the resistors by pressing component leads into the tie points in the field.
- Trim the resistors leads to keep the component body close to the board. This will also prevent long leads from shorting on the bottom metal of the board.
- Run jump wires to connect the divider to power and ground
- Keep your wiring neat, close to the board and easy to follow. A good way to do this is to route wires horizontally or vertically, making right-angle bends to change directions.
- Use the right length of wire. The right length of wire is the shortest length of wire that satisfies the previous guideline.
- Use the bus strips to distribute power supplies and ground.
- Connect the power supply to the breadboard.
- Use the black banana connector and blue bus strips for ground. Red bus strips are almost always used for power supplies.
- The exposed metal screws on the bottom of the banana connectors can short to the metal optical table. Cover them with electrical tape to prevent a calamity.
- When making wire connections to the banana terminals, be sure that only bare wire touches the terminal. Insulation under the screw terminal may cause an intermittent connection.
If you are unsure whether two holes on the breadboard are connected, insert short wires in the holes. Use the resistance or continuity features of the DMM to check if they are connected.
There are a few downsides to breadboards. They have high interconnect capacitance and resistance. If you don't know why that's bad, pay attention in lecture over the next few weeks and discuss with an instructor.
Connect the power supply
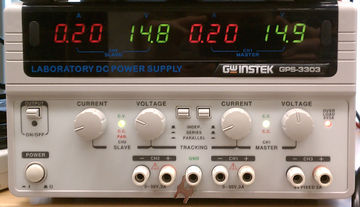
The lab power supplies provide three voltage outputs. The (+) and (−) outputs have adjustable current limits and voltages up to ±20V can be set either independently, or together (using the mode buttons located between the paris of voltage and current knobs). While the POWER button at lower left applies power to the supply itself, the white OUTPUT button on the upper left enables power to flow to the outputs: always remember to turn this off or disconnect it when rewiring your circuits. There is also one fixed 5V output at the lower left. Use this output with care, as it's current has a very hight limit, noted below the terminals as 3 A.
Connecting a wire directly from the power supply to a tie point is tenuous, so the breadboard also has four colored posts, which are visible in the image above right. These are called banana terminals. Each post accepts a banana connector inserted at the top and a bare wire at the base. The wire should be passed through the hole at the base of the post and secured with the colored plastic nut. A cable with banana connectors on both ends connects the power supply to the posts. The banana terminals are not connected to any tie points, so it is necessary to run a wires from the posts to tie points on the bus strips. Then wires must be run from the bus strips to the component power and ground leads.
Note that the green GND connector is connected to the power supply chassis ground (or AC power ground); it is not ground for your circuit.
- Connect the power supply to the breadboard with the banana cables.
- Measure VO and I with the supply to 2.5, 5, 10, and 15 Volts.
- Plot the measured values on the same set of axes.
Measure voltages with the DMM
The DMM has modes for measuring DC and AC signals. In DC mode, the meter reads the average value of the test signal. In AC mode, the meter reads the root-mean-square value of a time varying signal. In the Electronics Mini-Lab you will use DC mode, which is labeled with a solid line above a dashed line.
| Pic of connection | |
| Show realistic DMM model. Schematic showing how to measure voltage across R2. | Actual connections to measure voltage across R2. The voltage drop across a component is measured from the red, connected to the VΩ socket, to the black lead, connected to the COM socket. |
- Switch the DMM to DC voltage mode and connect the DMM test leads properly: Insert black in COM and red in VΩ.
- Make firm contact with the two leads across the terminals of R2.
- Record the resistance shown on the DMM.
- Record the uncertainty of the measurement.
- Calculate the change in the measured resistance if the DMM input impedance were 1 kΩ
Measure current with the DMM
| Pic of current measurement connection | |
| Show realistic DMM model.Schematic showing how to measure voltage across R2. | Actual connections to measure current through R2 and R2. Positive current is measured into the red lead, connected to the A socket of the DMM, and out of the black lead, connected to the COM socket. |
- Switch the DMM to DC current mode and connect the leads as shown in the figure.
- Place the leads of the DMM in series with the circuit loop.
- Record the current through your circuit at each input voltage in units of mA.
- For the highest voltage, quantitatively describe the effect of increasing the input impedance to 10 kΩ.
- Calculate the resistance of R2 using Ohm's law and each of the currents and voltages that you measured.
- Calculate the percent error in the measured resistance values.
- Compare to the tolerance value specified by the manufacturer.
The manufacturer's tolerance for the resistors in the lab is 5% of the nominal value. Therefore, the resistances in the circuit you build will be somewhat different than the nominal values you analyzed.
Measure the resistors with the DMM
The DMM serves as a voltmeter, an ammeter, an ohmmeter among other functions. The black (negative) lead always plugs into COM at the bottom of the meter while the red (positive) lead plugs into V/Ω for voltage and resistance measurements or into A for current measurements. The voltage and current measurement modes of the DMM are very different, so don't forget to reconnect the leads.
- If you have read ahead and already connected power to your circuit, make sure it is off.
- Disconnect the resistor you want to measure so that other parts of the circuit will not affect the resistance you measure.
- Switch the DMM to resistance mode, which is labeled with a Ω
- Place the DMM leads in parallel with the resistor of interest.
- Read and record the value on the DMM. Repeat for the second resistor.
- Calculate and record the difference from the specified value.
Part 2:making and characterizing a filter circuit
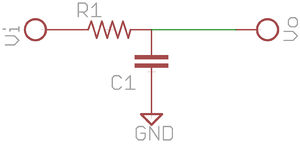
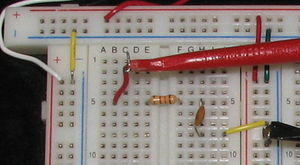
| RC filter circuit schematic. | RC filter on a breadboard. |
Time-varying signals and AC measurements
Generally, we refer to signals that vary with time as AC signals (alternating current, as opposed to DC - direct current). When we leave DC behind, the DMM we've used so far is no longer enough to observe what is happening. At this point, you'll need to get acquainted with the function generator and the oscilloscope, to generate and record AC signals, respectively. We'll also start making extensive use of BNC cables and connectors.
First, let's look at how the resistive voltage divider with which you're already familiar behaves with AC signals. Build the divider circuit as you did previously, but use the function generator in place of Vin, and the oscilloscope in place of the DMM.
Function Generator
A function generator generates signal waveforms for standard functions: sinusoids, triangles, square waves. The digital function generators in the lab generate waveforms at precise frequencies in the range from 0.01Hz to 10MHz, and amplitude range from about ±0.1V to ±10.0V. It can output waveforms with and without offset. Frequencies may be entered directly on the number keypad in units of Hz, kHz, and MHz or using the knob on the upper right hand side of the unit to change one digit at a time.
Oscilloscope
An oscilloscope ("scope" for short) is designed for observing signal waveforms that change faster than can be usefully seen on a DMM. Most often, the signals observed are periodic, and the scope is effectively a "time magnifier" letting you stretch and compress the timebase (as well as the waveform magnitude) for convenient viewing. The oscilloscopes used in the lab are digital. Digital scopes are essentially special purpose computers which digitize the analog inputs and display the data on an LCD. Digital scopes perform many basic measurement tasks such as peak-to-peak, frequency, and phase measurements. Most functions are controlled via menus. Below is a brief description of the most important controls:
- CH1, CH2 coax connectors: Signals connect to these via BNC cables.
- CH1, CH2 buttons: Activates channel menu. Allows selection of DC or AC coupling.
- Vertical Position knob: Changes zero position on display, shifting waveform up or down.
- Vertical Scale knob: Changes scale for selected channel (volts per division).
- Horizontal Scale knob: Changes time scaling (seconds per division).
- Measure button: Activates measure menu. Allows selection of up to 3 quantities to display on screen such as Vpp, frequency, and phase.
You will get a feel for these as you use the instrument in lab. You'll notice that the scope only measures voltages — there are no modes for directly measuring current or resistance. It's also important to remember that scope measurements are always referenced to ground. The shield (black lead when using grabber wires) of the BNC connector is hard-wired to ground. This means you can't use just one channel of a scope to measure the voltage between two non-ground nodes in a circuit.
- Set the frequency to 5kHz, and the waveform to sinusoid with no offset.
- Set the voltage to 3V peak-to-peak (often written as 3Vpp). Verify that the voltage is set as you intend with the scope, since there are no markings on the knob.
- Connect the waveform to your circuit.
- Use the other channel of the scope to measure Vpp across R2. You can display both the input and output waveforms at the same time by using the scope's dual mode. Does this resistive voltage divider behave any differently at AC than it did at DC? What's the relationship between the output and input waveforms?
Capacitors
An intuitive way to think about capacitor behavior is that they are reservoirs for electric charge, which take time to fill up or empty out. The size of the reservoir (the capacitance C) along with size of the pipe (intervening resistance between the voltage supply and capacitor) supplying the current determines how quickly or slowly. Circuits with capacitors in them have time- and frequency-dependent behavior. Capacitors act like open circuits at DC or very low frequencies, and like short circuits at very high frequencies.
Capacitors can be polarized or non-polarized. Polarized capacitors must always have the voltage applied to one terminal (the anode) positive relative to the other. One terminal or the other of a polarized capacitor is marked either + or − to indicate polarity. Polarized capacitors are typically used as bypass capacitors on power supply lines.
Now replace R2 with a capacitor in the 0.05-0.1 μF range. Again use dual mode on the scope to see both the input and output waveforms. Qualitatively observe what happens to the output as you change the frequency of the input. What kind of circuit is this?
Part 3:identifying unknown filter circuits
| RC filter circuit schematic. | RC filter on a breadboard. |
"Black-box" transfer functions
| |
Assignment: Measure and plot the transfer relations (magnitude and phase) for several "black-box" circuits. |
You'll find prepared for you several metal boxes with "mystery" circuits wired up inside, labelled "A" through "D". Your goal is to determine their transfer functions. Connect the waveform generator and oscilloscope to each "blue box" as shown with the waveform generator connected to both the input of the blue box and CH1 input of the oscilloscope and with the blue box output connected to CH2. Use the measure functions of the oscilloscope to measure Vpp of the input and output as well as the phase difference between the signals. Plot the ratio of the output to input versus frequency (as a log-log plot) and the phase vs frequency (as a lin-log plot).
Part 4:characterizing a photodiode
| Photodiode circuit schematic. | Photodiode circuit on a breadboard. |
Diodes
Diodes are non-linear devices. Diodes can function as an electronic "valve", as a light-emitter (LED), or a light-detector (photodiode). Diode as electrical "valve": In the simplest model, a diode acts as a one-way electrical valve — it behaves almost as a short circuit when a positive voltage is applied across it and as an open circuit with a negative voltage (reverse bias). For these reasons, diodes are frequently used in power supplies as rectifiers to convert alternating current (AC) to direct current (DC). As you might guess, this is not the whole story, and is only true for relatively large voltages. You will explore diode behavior in more detail, especially around the critical transition region near 0 volts. Photodiodes are optimized to work as a light detector by capturing photons and converting them to electrical signals. This happens when photons absorbed in the semiconductor generate electron-hole pairs. Run in reverse bias, the current out of the photodiode is linearly proportional to the light power striking the device. Light-emitting diodes (LEDs) are designed to output light when current passes through them. In this case, we have recombination of electron-hole pairs producing photons in the semiconductor. Light is emitted in forward bias, and power output depends on the current through the device.
All diodes exhibit breakdown when a large reverse voltage (typically > 50V) is applied, typically destroying the diode. Zener diodes however are designed to have a relatively low but precise breakdown voltage. These diodes are operated in reverse bias and are typically used as voltage references or limiters.
The circuit shown will be setup in the lab. It consists of a signal generator driving a diode in series with a 1kΩ resistor. The scope should be set to "X-Y" mode with the diode voltage on the x-axis and the resistor voltage (proportional to the diode current) on the y-axis. The scope will then display the v-i curve.
- Start by covering the window of a photodiode — with no light coming in, it is just a regular diode. Illuminate it to see its photodiode action.
- Sketch the curve displayed or use the scope "acquire" function to save the data to a thumb drive.
- For photodiode behavior, uncover the window of the device, and aim a Fiber-Lite illuminator at it. You should repeat the measurements you made at three levels of light intensity. You can now combine your data to produce four v-i curves for this diode at different light levels including the no-light condition. Plot these on the same graph to see how incident light affects diode v-i characteristics. You'll need this data for the Intro Electronics Lab Report.
| |
Describe format for submitted solution.Assignment: Measure and plot the current-voltage relationship for a diode in the transition region from non-conducting to conducting. |
Using an instrumentation amplifier to measure the photodiode IV characteristic
Explain the in
- Place integrated circuits so that the #1 lead is at the top left.
- Most types of components are placed so that they straddle the notch.
Circuit Components
Operational Amplifiers
Move this material to DNA Lab Manual
In the upcoming lab module we will start using integrated circuits (ICs) known as operational amplifiers, or op-amps. They are an enormously versatile circuit component, and come in hundreds of special varieties, built to have particular characteristics and trade-offs. We will use some very common general-purpose op-amp, of which a typical example is the LM741.
Every op-amp manufacturer provides a datasheet for every IC they make, and you should always familiarize yourself with it. It provides information on everything from pin and signal connections, to special features, limitations, or applications of a particular IC. We have copies of the datasheets available on-line for the op-amps we used in the lab.
Besides the (−) and (+) (inverting and non-inverting) inputs, an op-amp needs DC power connections, which is what enables it to be an active circuit element. These power connections are usually omitted on a schematic, but always shown on the datasheet. Typically ±15 volts is used, but you should check the datasheet to be sure.
For powering op-amp circuits, you will use the power supply in SERIES mode. In SERIES mode, the (+) output of CH2 is connected to the (−) output of CH1, so that CH1+ is the V+ power for the op-amps and CH2− is V− power and CH1− is ground (0V) for your circuit.
Every IC has a marking on the package to indicate pin 1, and the datasheet shows the relative positions of the other pins. On the LM741 there is a dot near pin 1 (or a semi-circle on one end of the chip). NC on the datasheet stands for No Connection.
Important: ICs are sensitive to static electricity discharges. Your body can easily store enough charge to damage an IC, especially on a dry winter day. To prevent this, always make sure to touch the grounded metal case of an instrument to dissipate the charge. Use caution when handling the chips.

