Difference between revisions of "Confocal Wiki"
(→Circuit Design) |
(→Design) |
||
| Line 1: | Line 1: | ||
=Design= | =Design= | ||
==Optical Setup== | ==Optical Setup== | ||
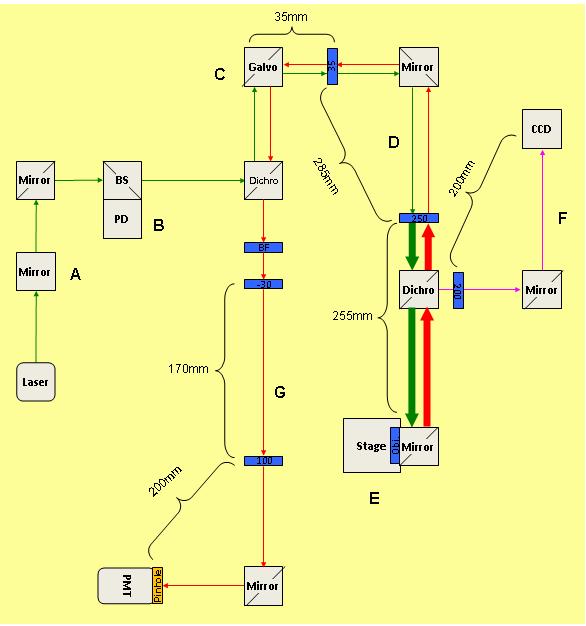
| − | + | [[File:Beam path confocal.JPG|center|thumb|600px]] | |
| − | + | ||
==Circuit Design== | ==Circuit Design== | ||
Revision as of 03:49, 19 May 2011
Design
Optical Setup
Circuit Design
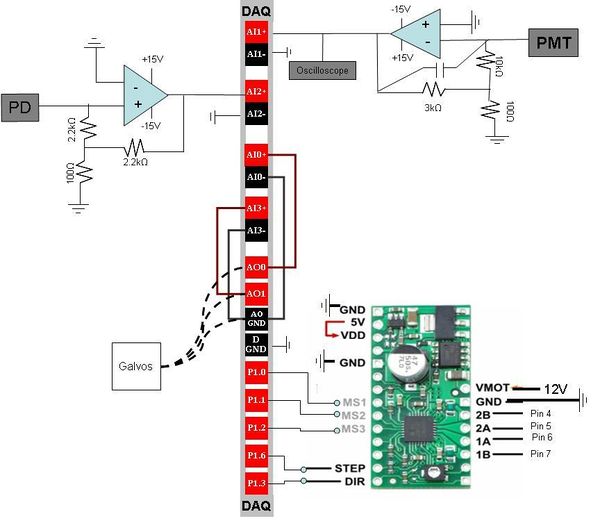
Stepper Motor Driver The stepper motor driver is powered by a 12V power supply. The driver takes output voltage from the DAQ and converts it into signals that moves the stepper motor that controls the stage in the Z direction. 2B and 2A connect to coil 2 and 1A and 1B connect to coil 1 of the stepper motor.
INSERT a chart below!!
- Presumably the Limit Switch pins allow you to set a max/min voltage to the stepper motor to prevent damaging the motor. We have not yet figured out how this works. However, the pins are connected to the DAQ so that the output can be read and understood.
When STEP turns high/low, the motor takes a step. DIR controls the direction (up or down) of the stepper motor. High = up, Low = down. MS1, MS2, MS3 allow for fractional steps, up to 1/16th of a full step.
The maximum current tolerated by the stepper motor is 1A. The current output by the stepper motor driver is given by the equation:
Where RS = 0.05 Ω and VREF is the output of the 6th pin from the top left of the stepper motor driver (one below GND, two above MS1). The output the VREF can be adjusted by screwing Δ. ITripMAX should be less than 1A. We worked with ITripMAX as ~0.5A, or VREF ~ 0.2V.
FIGURE OUT HOW TO INSERT EQUATIONSItalic text (otherwise bring them in as pictures) Photodiode Correction When visualizing the laser signal, it was apparent from analyzing the noise that the variation of the laser signal was stochastic. To correct for the propagation of this noise to the value of fluorescence we measured through the PMT, we utilized a photodiode. We placed a beam splitter that would divert a portion of the light into the photodiode. We then used the photodiode output to attempt to correct the PMT output.
The PMT output is characterized as
〖PMT〗_outputi=m_3 (I_(∆_i )+ I_(b_i ) )*N_(f_i )+ PMT(I=∅)
with m_3 representing the conversion factor from intensity to voltage for the PMT, N_(f_i ) representing the number of fluorophores in the sample, I_(∆_i ) representing the change in intensity due to the stochastic variation of the laser and I_(b_i ) representing the intensity of the baseline laser signal. PMT(I=∅) represents the offset of the PMT value.
The PD output is characterized as
〖PD〗_outputi=m_1 (I_(∆_i )+ I_(b_i ) )+ PD(I=∅) with m_1 representing the conversion factor from intensity to voltage for the PD, I_(∆_i ) representing the change in intensity due to the stochastic variation of the laser and I_(b_i ) representing the intensity of the baseline laser signal and the fluorescence in the sample. PD(I=∅) represents the offset of the PMT value. A rearrangement of these equations results in the final formula
〖PMT〗_outputi-PMT(I=∅)=m_3/m_1 (〖PD〗_outputi-PD(I=∅))*N_(f_i ) Our goal is to use our PMToutput and our PD output to find the value of N_(f_i )which will provide us with the value of the intensity of fluorophores in each location in our image. If we subtract the PMT offset from the PMT reading and proceed similarly with subtracting the PD offset from the PD reading, we can calculate ΔPMT and ΔPD.
∆PMT/∆PD= m_3/m_1 *N_(f_i ) Since we will be rescaling the N_(f_i )so that the range of values is 0 to 1, we do not need to worry about the m3 and m1 factors assuming that they will vary constantly with different intensities, an assumption that future students should confirm. If this assumption proves to be incorrect, the scaling factors of m3 and m1 should be calculated separately.
Original Image
Corrected Image using the Photodiode

