20.309: Biological Instrumentation and Measurement
This is Part 1 of Assignment 5.
Estimating the diffusion coefficient by tracking suspended microspheres
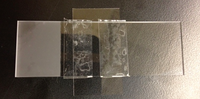
Imaging chamber for fluorescent microspheres diffusing in water:glycerol mixtures
1. Track some 0.84μm Nile Red Spherotech polystyrene beads in water-glycerin mixtures (Samples A and B contain 30% and 50% glycerin, respectively).
- Notes: Fluorescent microspheres have been mixed for you by the instructors into water-glycerin solutions A and B. (a) Vortex the stock Falcon tube, and then (b) transfer the bead suspension into its imaging chamber (consisting of a microscope slide, double-sided tape delimiting a 2-mm channel, and a 22mm x 40mm No. 1.5 coverslip, and sealed at both ends nail polish).
- Tip 1: Do not choose to monitor particles that remain stably in focus: these are likely to be 'sitting on the coverslip' and their motion will not be representative of diffusion in the viscous water-glycerol fluid.
- Tip 2: Limit the ROI to a region with only 3 or 4 particles. Long movies with the whole field of view is a sure way to make MATLAB complain.
2. Estimate the diffusion coefficient of these samples: MSD = $ \left \langle {\left | \vec r(t+\tau)-\vec r(t) \right \vert}^2 \right \rangle=2Dd\tau $, where r(t) = position, d = number of dimensions, D = diffusion coefficient, and $ \tau $= time interval.
- Consider how many particles you should track and for how long. What is the uncertainty in your estimate?
- From the viscosity calculation, estimate the glycerin/water weight ratio. (This chart is a useful reference. If that link doesn't work try this one.)

|
Turn in for the viscosity part:
- Procedure
- Document the samples you prepared and used and how you captured images (camera settings including frame acquisition rate, number of frames, number of particles in the region of interest, choice of sample plane, etc)
- Data
- Include a snapshot of the 0.84 μm fluorescent beads monitored.
- Plot two or more example bead trajectories for each of the glycerin samples. (Hint: If you subtract the initial position from each trajectory, then you can plot multiple trajectories on a single set of axes.)
- Analysis and Results
- Plot the average MSD vs τ results for the two glycerin samples (A and B); use log-log axes. Use the minimum number of axes that can convey your results clearly.
- Include a table of the diffusion coefficient, viscosity and glycerin/water ratio for each of the samples (A and B)
- Provide a bullet point outline of all calculations and data processing steps.
- Discussion
- How do your viscosity calculations compare to your expectations? (This chart is a useful reference.)
- Include a thorough discussion of error sources and the approaches to minimize them. It may be helpful to list out the error sources in a table, including a category for the error source, type of error (random, systematic, fundamental, technical, etc.), the magnitude of the error, and a description and way to minimize each one.
|
Back to Assignment 5.

