Assignment 4 part 2: Measure resolution
From Course Wiki
Revision as of 14:45, 29 September 2017 by Steven Wasserman (Talk | contribs)
Overview
In this part of the assignment, you will measure the resolution of your microscope using image processing code that you will develop.
Measuring resolution
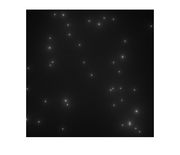
EstimateResolutionFromPsfImage takes a point-source image and estimates the resolution of an optical system. It uses the built-in MATLAB function im2bw to locate bright regions and regionprops to measure attributes of each connected region of bright pixels. After rejecting outliers, the function uses nlinfit to estimate best fit Gaussian parameters for each bright spot. The optional second argument controls the rejection range for outliers.
There are four subfunctions that should be included in the same m-file as EstimateResolutionFromPsfImage.
function [ Resolution, StandardError, BestFitData ] = EstimateResolutionFromPsfImage( ImageData, OutlierTolerancePercentage )

    if( nargin < 2 )
        OutlierTolerancePercentage = [ 0.7 1.3];
    end

    ImageData = im2double(ImageData);

    figure(1);
    imshow( ImageData );
    hold on;
    title( 'PSF Image' );

    % create bilevel image mapping bright regions
    thresholdLevel = 0.5 * ( max( ImageData(:) ) + median( ImageData(:) ) ); % this may not work in all cases
    binaryImage = im2bw( ImageData, thresholdLevel );
    % increase the size of each connected region using dilation
    dilatedImage = imdilate( binaryImage, strel( 'disk', 7, 0 ) );
    % remove objects touching the edges
    dilatedImage = imclearborder( dilatedImage );

    % assign a unique object number to each connected region of pixels
    labeledImage = bwlabel( dilatedImage );

     % draw a red circle around labeled objects
    CircleObjectsInImage( labeledImage, [ 1 0 0 ] );

    % compute the parameters of each object identified in the image
    objectProperties = regionprops( dilatedImage, ImageData, ...
        'Area', 'Centroid', 'PixelList', 'PixelValues', 'MaxIntensity' );

    % eliminate outliers -- PSF beads that are touching, aggregates, etc...
    % begin by eliminating objects whose areas are outliers, as occurs when
    % beads are too close
    medianArea = median( [ objectProperties.Area ] );
    outliers = [ objectProperties.Area ] > OutlierTolerancePercentage(2) * medianArea | [ objectProperties.Area ] < OutlierTolerancePercentage(1) * medianArea;

    if( sum( outliers ) > 0 )
        dilatedImage = RemoveObjectsFromImage( dilatedImage, objectProperties( outliers ) );
        objectProperties( outliers ) = [];  % remove outliers
    end

    CircleObjectsInImage( dilatedImage, [ 1 1 0 ] );

    % next eliminate intensity outliers
    medianMaxIntensity = median( [ objectProperties.MaxIntensity ] );
    outliers = [ objectProperties.MaxIntensity ] > OutlierTolerancePercentage(2) * medianMaxIntensity | [ objectProperties.MaxIntensity ] < OutlierTolerancePercentage(1) * medianMaxIntensity;
    outliers = outliers | [ objectProperties.MaxIntensity ] > 0.995;

    if( sum( outliers ) > 0 )
        dilatedImage = RemoveObjectsFromImage( dilatedImage, objectProperties( outliers ) );
        objectProperties( outliers ) = [];
    end

    % circle all the remaining objects in green
    CircleObjectsInImage( dilatedImage, [ 0 1 0 ] );
    LabelObjectsInImage( objectProperties );
    hold off;

    BestFitData = cell(1, length(objectProperties));

    % use nlinfit to fit a Gaussian to each object
    for ii = 1:length(objectProperties)
        % initial guess for sigma based on area of bright spot
        maximumPixelValue = max( objectProperties(ii).PixelValues );
        darkPixelValue = median( objectProperties(ii).PixelValues );
        pixelCountAboveHalf = sum( objectProperties(ii).PixelValues > .5 *  ( maximumPixelValue + darkPixelValue ) );
        sigmaInitialGuess = 0.8 * sqrt( pixelCountAboveHalf / 2 / pi / log(2) );

        initialGuesses = [ ...
            objectProperties(ii).Centroid(1), ... % yCenter
            objectProperties(ii).Centroid(2), ... % xCenter
            max(objectProperties(ii).PixelValues) - min(objectProperties(ii).PixelValues), ... % amplitude
            sigmaInitialGuess, ... % (objectProperties(ii).BoundingBox(3) - 6) / 4, ... % sigma
            min(objectProperties(ii).PixelValues) ];

        BestFitData{ii} = nlinfit( objectProperties(ii).PixelList, objectProperties(ii).PixelValues, @Gaussian2DFitFunction, initialGuesses );

        % plot data, initial guess, and fit for each peak
        figure(2)
        clf

        % generate a triangle mesh from the best fit solution found by
        % nlinfit and plot it
        gd = delaunay( objectProperties(ii).PixelList(:,1), ...
            objectProperties(ii).PixelList(:,2) );
        trimesh( gd, objectProperties(ii).PixelList(:,1), ...
            objectProperties(ii).PixelList(:,2), ...
            Gaussian2DFitFunction(BestFitData{ii}, ...
            objectProperties(ii).PixelList ) )
        hold on

        % plot initial guesses -- commented out to make plots less
        % cluttered. put this back in to debug initial guesses
        % plot3( objectProperties(ii).PixelList(:,1), ...
        %   objectProperties(ii).PixelList(:,2), ...
        %   Gaussian2DFitFunction(initialGuesses, ...
        %   objectProperties(ii).PixelList ), 'rx' )

        % plot image data
        plot3( objectProperties(ii).PixelList(:,1), ...
            objectProperties(ii).PixelList(:,2), ...
            objectProperties(ii).PixelValues, 'gx', 'LineWidth', 3)
        title(['Image data vs. Best Fit for Object Number ' num2str(ii)]);
    end

    allPeakData = vertcat( BestFitData{:} );
    Resolution = mean( allPeakData(:,4) ) ./ 0.336;
    StandardError = std( allPeakData(:,4) ./ 0.336 ) ./ sqrt( length( BestFitData ) );
end

function out = Gaussian2DFitFunction( Parameters, Coordinates )
    yCenter = Parameters(1);
    xCenter = Parameters(2);
    amplitude = Parameters(3);
    sigma = Parameters(4);
    offset = Parameters(5);

    out = amplitude * ...
        exp( -(( Coordinates(:, 1) - yCenter ).^2 + ( Coordinates(:, 2) - xCenter ).^2 ) ...
        ./ (2 * sigma .^ 2 )) + offset;

end

function CircleObjectsInImage( LabelImage, BorderColor )
    boundaries = bwboundaries( LabelImage );
    numberOfBoundaries = size( boundaries );
    for k = 1 : numberOfBoundaries
        thisBoundary = boundaries{k};
        plot(thisBoundary(:,2), thisBoundary(:,1), 'Color', BorderColor, 'LineWidth', 2);
    end
end

function LabelObjectsInImage( ObjectProperties )
    labelShift = -9;
    fontSize = 10;

    for ii = 1:length(ObjectProperties)
        unweightedCentroid = ObjectProperties(ii).Centroid;		% Get centroid.
        text(unweightedCentroid(1) + labelShift, unweightedCentroid(2), ...
            num2str(ii), 'FontSize', fontSize, 'HorizontalAlignment', ...
            'Right', 'Color', [0 1 0]);
    end
end

function OutputBinaryImage = RemoveObjectsFromImage( InputBinaryImage, ObjectProperties )
    OutputBinaryImage = InputBinaryImage;
    eliminatedPixels = vertcat( ObjectProperties.PixelList );
    allObjectIndexes = sub2ind( size( InputBinaryImage ), ...
        eliminatedPixels(:, 2), eliminatedPixels(:,1) );
    OutputBinaryImage( allObjectIndexes ) = 0;
end

% initial version 9/23/2013 by SCW
Testing the code
{{

