Assignment 4: finding and measuring things
Overview
In this assignment, you will develop two pieces of image-processing software. The first function will measure the size of bright spots in an image. You will use this function to measure the resolution of your microscope. The second piece of software will track the positions of multiple particles through a sequence of frames. You will use assess how precise your position measurements are. In the next assignment, you will use the particle tracking software to measure the mean squared displacement of particles in fluids and inside of cells. You may choose any software development environment you like. Examples and starter code will be supplied in MATLAB.
Measuring resolution
One of the most commonly used definitions of resolution is the distance between two point sources in the sample plane such that the peak of one source’s image falls on the first minimum of the other source’s image. This suggests a procedure for measuring resolution: image a point source; measure the peak-to-trough distance; and divide by the magnification. In this part of the lab, you will use this method to estimate the resolution of your microscope.
A practical problem with this method is that true point sources are difficult to come by. If you are using a telescope, stars are readily available, reasonably bright, and an excellent approximation to a point source. Instead of stars, microscopists usually use tiny, fluorescent beads as approximate point sources. These beads are small enough to be considered point sources. You will use nonlinear regression to estimate the resolution of your microscope from an image of the tiny beads. Unfortunately, beads small enough for this purpose are not very bright. Imaging them can be challenging. Your microscope must be aligned very well to get good results.
You will use image processing functions to locate the beads in your image and fit a Gaussian function to them. Gaussians are more amenable to nonlinear regression than Bessel functions, and they are a very good approximation. It is straightforward to convert the Gaussian parameters to Rayleigh resolution. See Converting Gaussian fit to Rayleigh resolution for a discussion of the conversion.
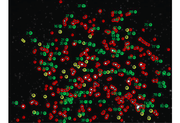
- Make an image of a sample of 170 nm fluorescent beads with the 40X objective. (Several dozens to hundreds of PSF spheres should be captured in your image.)
- Use 12-bit mode on the camera and make sure to save the image in a format that preserves all 12 bits.
- Use
imhistto ensure that the image is exposed properly.- Since there are a very small number of bright pixels, plot the histogram counts on a logarithmic scale.
- Include the image and the histogram in your lab report.
- Use image processing functions to locate non-overlapping, single beads in the image.
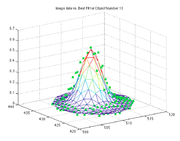
- Use nonlinear regression to fit a Gaussian to each bead image.
- Convert the Gaussian parameters to resolution.
- Report the results in your lab report.
- This page has example MATLAB code.
- Discuss how the measured resolution compares with the theoretical value.
Segmentation
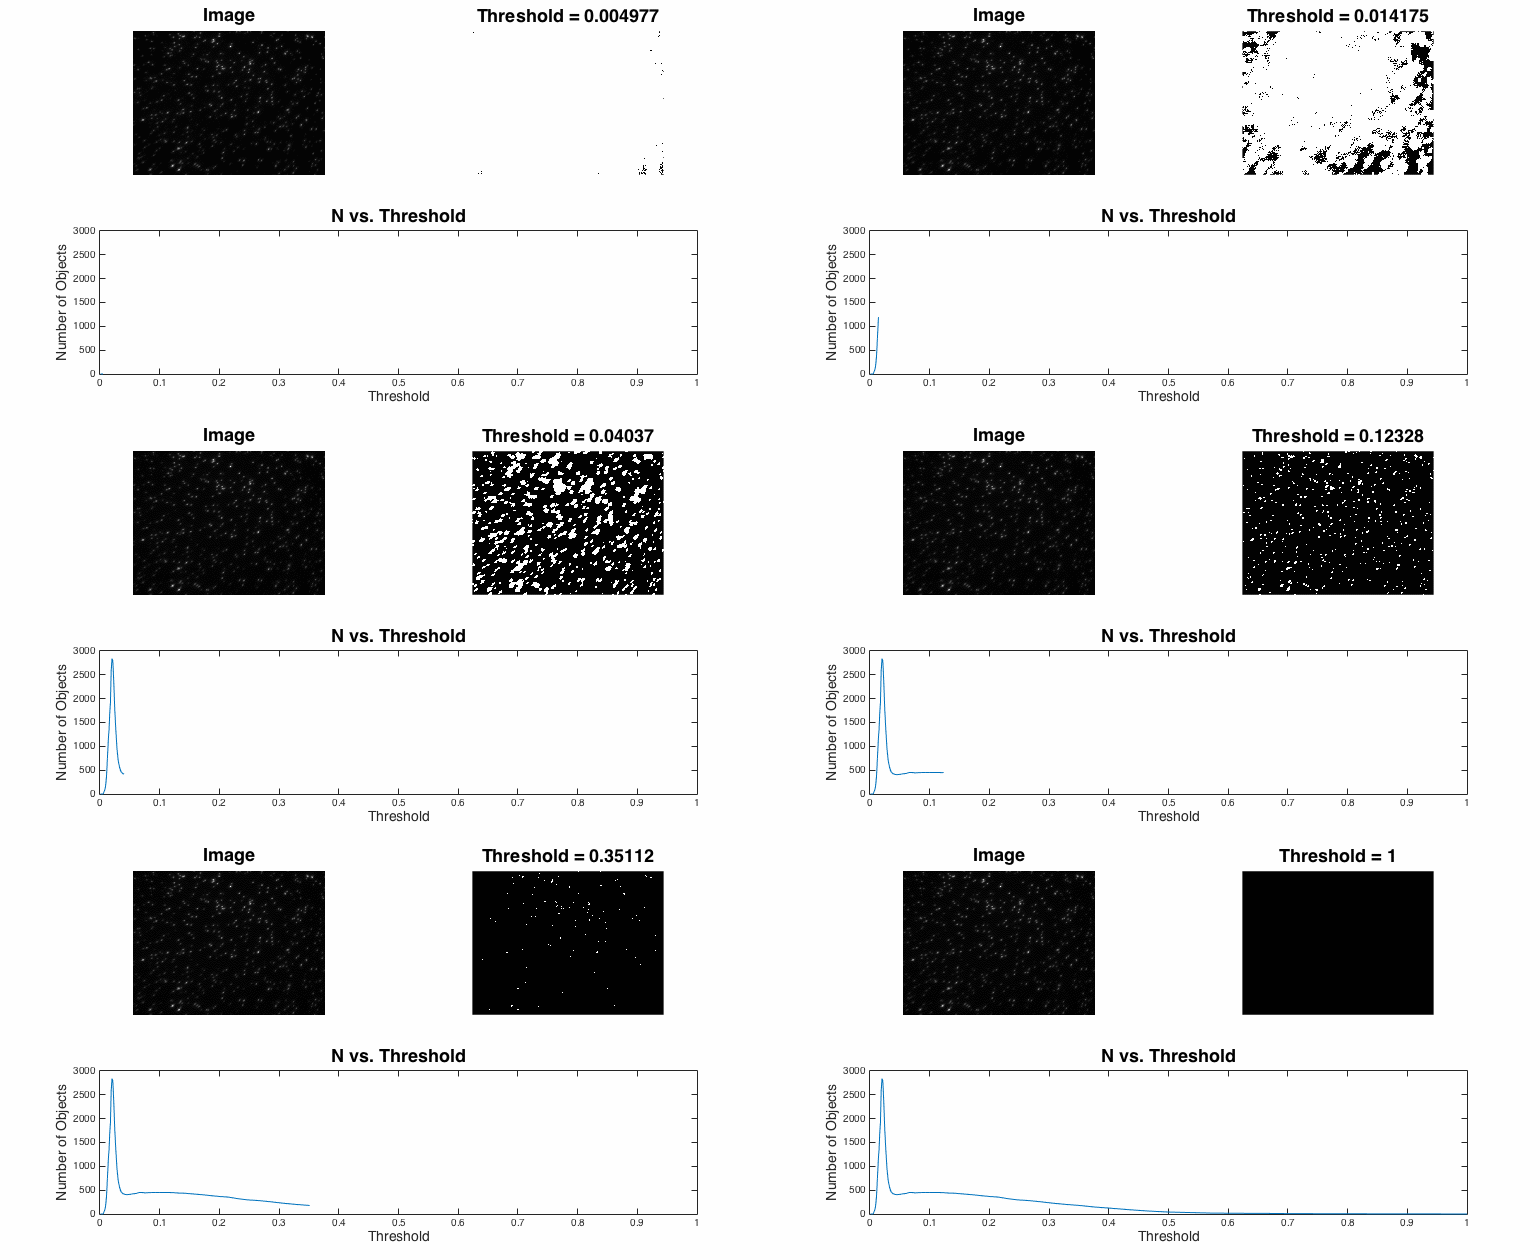
Segmentation is the process of assigning pixels in an image into groups.In most fluorescent, microscopic images, the concept is pretty simple: the bright stuff is interesting and the dull stuff is dark. There are many approaches to segmentation ... global threshold. ...


