Difference between revisions of "20.109(S24):M1D4"
Noreen Lyell (Talk | contribs) (→Strategy: Research the amino acid residues relevant in Myc:MAX binding) |
Noreen Lyell (Talk | contribs) (→Strategy: Research the amino acid residues relevant in Myc:MAX binding) |
||
| Line 131: | Line 131: | ||
<font color = #4a9152 >'''In your laboratory notebook,'''</font color> complete the following: | <font color = #4a9152 >'''In your laboratory notebook,'''</font color> complete the following: | ||
| + | |||
| + | *For each of the key residues listed above, what are the characteristics of the residue that might influence binding? For example, is the residue polar / hydrophobic / charged? | ||
| + | *For each of the key residues listed above, to what types of functional groups might it bind? | ||
| + | *For each of the key residues listed above, are there any small molecule hits from the SMM screen that have functional groups that might bind the residue? | ||
==Navigation links== | ==Navigation links== | ||
Next day: [[20.109(S24):M1D5 |Prepare differential scanning flourimetry (DSF) experiment]] <br> | Next day: [[20.109(S24):M1D5 |Prepare differential scanning flourimetry (DSF) experiment]] <br> | ||
Previous day: [[20.109(S24):M1D3 |Assess purity and concentration of expressed protein]] <br> | Previous day: [[20.109(S24):M1D3 |Assess purity and concentration of expressed protein]] <br> | ||
Revision as of 18:23, 21 February 2024
Contents
Introduction
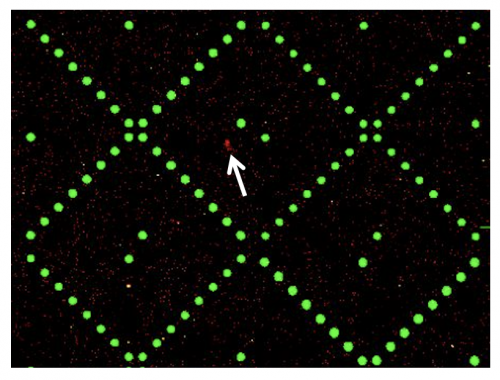
Today you will analyze the data for the SMM screen completed by the Sp23 class of 20.109! For this experiment, students incubated SMM slides with purified MAX-6xHis protein in an effort to identify ligand binders. To identify which of the small molecules, if any, that were screened are able to putatively bind MAX-6xHis, the slides were evaluated using a Genepix microarray scanner. The scanner measured the fluorescence signal emitted from each spot on the slide where a ligand was printed. Considering that neither the ligands nor MAX protein is fluorescent, from where does this signal arise?
The above image is from raw data generated during the SMM screen. The green spots represent locations on the SMM slide where fluorescein was printed. As a reminder, fluorescein is a fluorescent dye used for alignment purposes. Correct alignment is critical to knowing which ligands are in which spots on the slide. Red spots are indicative of ligands that are bound by MAX-6xHis (example denoted by white arrow in above image). The signal is due to the Alexa Fluor® 647, a fluorophore that was conjugated to an antibody that is specific to the 6xHis tag.
When the slides are imaged, the scanner exposes the SMM to excitation light specific to the fluorophores used in the experiment (i.e. wavelengths that excite fluorescein and the Alexa Fluor 647 bound to MAX-6xHis). The scanner then detects the intensity of the emitted fluorescence light to generate an image that can be analyzed. This analysis will provide a list of 'hits' that can be used to direct future studies.
Protocols
Part 1: Participate in Communication Lab workshop
Our communication instructor, Dr. Chiara Ricci-Tam, will join us today to focus on figure design.
Part 2: Analyze results of SMM screens
After the Sp23 class completed the SMM slide preparation steps, the Instructors imaged the slides and completed the initial data analysis as outlined in prelab. Here you will complete the data analysis to review the hits identified for MAX-6xHis.
- Download the SMM results .csv file from the class data page, and save it to the desktop with the jupyter notebook file.
- Open Anaconda Navigator.
- On the home screen, you will first change the environment.
- In the dropdown that shows 'base (root)', select 'SMM_Analysis'.
- Launch the Jupyter notebook by clicking "launch" in the appropriate panel.
- Do not interrupt the terminal!
- A web browser will open when the the Jupyter notebook is active.
- Select Desktop folder.
- Select Sp23 SMM Analysis.ipynb.
- Before running the Jupyter notebook analysis pipeline, you will need to enter the name of the appropriate .csv file.
- Go to In [5] and delete 'HECT_screen.csv'.
- Enter 'screen_results.csv'.
- To run the analysis, select In [1] of the code and click 'Run' from the toolbar at the top of the Jupyter notebook window.
- Wait for the analysis to complete before running the next section.
- When the analysis from In [1] is running, an asterisk will appear in the place of the 1. When the analysis is completed the 1 will reappear.
- Read through the content provided after In [1].
- Then complete each step of the analysis (one at a time!) by completing the Step #8 for each of the cells.
- Be sure the content provided for each step of the analysis as you go.
- When you reach the section titled "Histograms - Finding the Z score threshold" you will use the preset threshold of 10 for the data analysis.
- After you run this analysis two histograms will appear in the cell.
- Using the information provided in prelab you will refine the threshold to better define hits attained in your experiment.
- To repeat the analysis with your refined threshold, enter the value you decide after 'zscore_h = ' in the cell.
- The default value of 10 will be present, simply delete and enter your value.
- Rerun the selected cell.
- In your laboratory notebook, complete the following:
- Record the threshold value selected.
- Attach screen captures of the histograms.
- The run from the section titled "Scatter Plot - Data distribution and consistency between replicates" will generate a scatter plot.
- In your laboratory notebook, complete the following:
- Provide an assessment of the distribution based on the prelab discussion.
- The run from the section titled "Hits: calling, visualizing and validating" will generate a table with the information for the hits to MAX-6xHis.
- In the 'Calling hits' sub-section, the analysis will result in a hit rate for your screen. Read the content provided below the hit rate to better refine your list of hits according to the ideal hit rate.
- In your laboratory notebook, complete the following:
- Record initial hit rate from the default threshold value.
- Describe the changes made to the threshold based on the initial rate and record the final threshold value you chose.
- Record the final hit rate determined after changing the threshold.
- In the 'Visualize hits structures with rdkit' sub-section, the analysis will show chemical structures for the hits.
- To complete visual identification of common features, you can download the image to see all of the structures together.
- You will use this for Part 2!
- In the 'Validating hits' sub-section, the analysis will provide a table with information for each of the hits.
- The by-eye analysis described was completed for you as specific software is needed to visualize the individual spots. Read through the direction so you know how this was done.
- In your laboratory notebook, complete the following:
- Record the following information from the spreadsheet: Internal_ID, Zscore_Rep1, and Zscore_Rep2.
Part 3: Choose small molecules for DSF experiment
Each team will test four of the small molecules identified in the SMM screen using functional assays. In this exercise you will choose the small molecules you want to test!
Though you can randomly choose small molecules for your experiments, it is best to be more thoughtful in your choices. If there is a hypothesis driving your choices it will be easier for you to write about your results in the Data summary assignment. Remember that it is helpful to craft a story when relaying your research to a broad audience. If you choose your small molecules using a strategy you can explain to your reader they will be better equipped to follow the data and understand the results. Also, it is easier to write about your data and results if you have a motivation that drives why you tested certain small molecules.
Below are three strategies that you can use to choose your small molecules. Complete the notebook entries for all three strategies by examining the spreadsheet of small molecules linked here. This list contains top hits from the SMM that we were able to acquire from a commercial vendor.
Use the information you gather from answering the notebook questions for each of the strategies to make your final decision. Or if you would rather use a different strategy to choose your small molecules, include your rationale in your notebook. When you know which small molecules you want to test, email your list to your Instructor. Be sure to send your list no later than the day before your next laboratory session!
Strategy: Identify common features present in small molecules
One strategy for choosing your small molecules is to visually inspect known small molecule binders for common features / structures. To do this, examine the the chemical structures for each of the hits in the spreadsheet and identify any common features / functional groups. As in the image below, it is possible that multiple features will be present within the same small molecule. Why is this a useful exercise? Perhaps a feature present in several of the putative small molecule binders is relevant to what types of chemistries are important for binding to MAX.
In your laboratory notebook, complete the following:
- How many features did you identify that are present in two or more of the small molecules that putatively bind MAX-6xHis? Are there more or less than you expected?
- Is there a feature present in all of the identified small molecules? What might this suggest about the binding site(s) and / or binding ability of MAX?
- Can you assign the identified small molecules to sub-groups based on the common features that are present?
- What might the different features represent? More specifically, consider whether each subgroup has a unique binding site on the target protein or if each subgroup represents different possibilities for interacting with the same binding site.
Strategy: Consider the binding metrics from the SMM screen
Another strategy for choosing your small molecules is to examine the metrics provided by the SMM screen for each of the hits. In the spreadsheet information regarding the Z-score is included. Remember that the Z-score reports the signal:noise ratio. Why is this useful? Perhaps having a higher signal indicates better binding to the MAX protein. Thought the SMM does not provide details about affinity or specificity, the amount of signal is presumably related to the amount of protein bound.
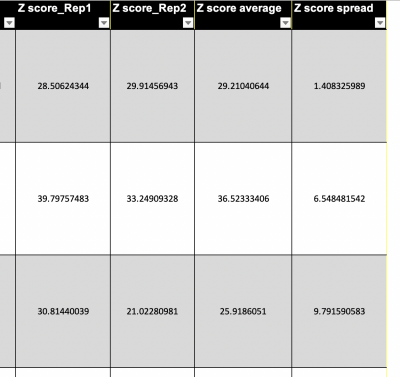
A portion of the spreadsheet is shown in the image to the right. In the SMM screen, two replicates for each small molecule were included. The Z-scores for the replicates are included in separate columns of the spreadsheet as 'Z score_Rep1' and 'Z score_Rep2'. The average calculated from the replicates is included as the 'Z score average'. In addition the 'Z score spread' is included in the spreadsheet. This value represents the variation in the data, or the numerical distance between replicate Z-score values.The spread of the data can provide context on the validity and reproducibility of the data. If one replicate has a relatively high Z-score compared to and the other replicate has a Z-score near background, then maybe the first replicate is a false-positive. Or maybe the second replicate is a false-negative. When the two Z-score values are similar, this could indicate that the small molecule is a 'true' hit.
In your laboratory notebook, complete the following:
- List the five small molecules with the highest Z-scores.
- List the five small molecules with the lowest spread.
- Are there any small molecules that are on both lists?
Strategy: Research the amino acid residues relevant in Myc:MAX binding
An additional strategy for choosing your small molecules is to research what is known about key residues in the MAX protein that are involved in Myc binding. Why is this useful? Perhaps some of the small molecules identified in the SMM screen have features that are known to interact with certain amino acids. An example of this may work comes from the protein purification protocol you used. As a reminder, the imidazole group of histidine binds to nickel nitrilotriacetic acid (Ni-NTA) enabling 6xHis-tagged proteins to be separated from the cell lysate.
To identify residues in MAX that are important for Myc:MAX binding, you will review published literature. Because the research regarding Myc:MAX binding is plentiful, we identified two papers that can guide you as you choose which small molecules might be worth testing in the functional assays. Feel free to seek additional sources if this is a strategy of interest to you.
In the first paper, the binding of Myc:MAX binding is examined as part of a review focused on Myc function. Review articles are a great place to start when exploring a new research topic. The role of review articles is to summarize the existing literature on a given topic. In this, review articles provide the current state of the field and a compiled list of relevant citations that can be used to further investigate key areas of ongoing research in the field.
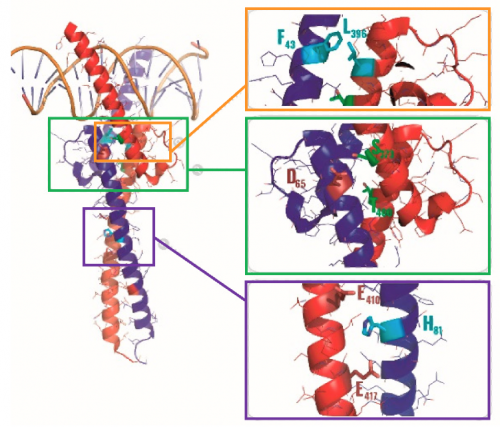
The review article highlights three key points of contact that are important to Myc:MAX binding. The MAX residues that are important in Myc:MAX binding are provided below. If you would like more information regarding these Myc:MAX interactions, the full-length review article can be found here.
- Binding between Myc and MAX occurs at the helix-loop-helix regions of each protein (shown in orange box in image below). Key residue is MAX-Phe43.
- Phosphorylation sites in Myc and MAX have a role in the interaction between the proteins (shown in green box in image below). Key residue is MAX-Asp65.
- Interfacial, buried interaction occurs between Myc and MAX proteins (shown in purple box in image below). Key residue is MAX-His81.
The second paper focuses on DNA binding site recognition using x-ray structures of MAX bound to Myc. This paper is a primary literature source as it is a direct report of findings from the laboratory that made the discovery. Primary literature provides the details regarding how a specific research question was answered. In this, primary literature is more narrow in scope compared to review articles.
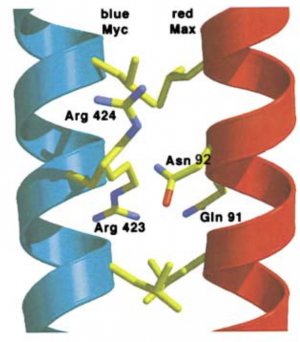
This paper identifies one key point of contact that is important in Myc:MAX binding. The MAX residues that are important in Myc:MAX binding are provided below. If you would like more information regarding these Myc:MAX interactions, the full-length review article can be found here.
- Hydrogen bond pairs are created by residues in the tetrad region that yield tighter binding (shown in image below). Key residues are MAX-Asn92 and MAX-Gln91.
In your laboratory notebook, complete the following:
- For each of the key residues listed above, what are the characteristics of the residue that might influence binding? For example, is the residue polar / hydrophobic / charged?
- For each of the key residues listed above, to what types of functional groups might it bind?
- For each of the key residues listed above, are there any small molecule hits from the SMM screen that have functional groups that might bind the residue?
Next day: Prepare differential scanning flourimetry (DSF) experiment


