Difference between revisions of "20.109(S22):M1D5"
Noreen Lyell (Talk | contribs) (→Part 3: Perform aggregation assay) |
Noreen Lyell (Talk | contribs) (→Part 3: Perform aggregation assay) |
||
| Line 54: | Line 54: | ||
#Carefully carry your tubes to the front laboratory bench and load into the 96-well plate where indicated by the Instructor. | #Carefully carry your tubes to the front laboratory bench and load into the 96-well plate where indicated by the Instructor. | ||
#*Be sure to record the plate and well information for the location of your samples so you can retrieve your data at the end of the day! | #*Be sure to record the plate and well information for the location of your samples so you can retrieve your data at the end of the day! | ||
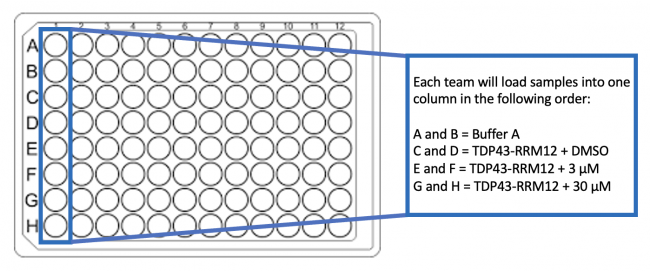
| − | #To load your samples into the 96-well plate, add 200 μL from each tube into two separate wells according to the plate map below. [[Image:Sp22 M2D5 aggregation plate map.png|center| | + | #To load your samples into the 96-well plate, add 200 μL from each tube into two separate wells according to the plate map below. [[Image:Sp22 M2D5 aggregation plate map.png|center|650px|thumb]] |
#*This will result in duplicate samples for each of the conditions. | #*This will result in duplicate samples for each of the conditions. | ||
#*Be very careful not to lose any of your sample when pipetting as all of the liquid will be used for each condition! | #*Be very careful not to lose any of your sample when pipetting as all of the liquid will be used for each condition! | ||
Revision as of 19:18, 14 February 2022

Contents
Introduction
Today you will perform the first of two functional assays aimed at assessing the small molecules that were identified using the SMM technology. In this assay, you will examine the effect of the small molecules you choose on aggregation. Protein aggregation refers to the biological process by which intrinsically disordered or mis-folded proteins associate to form an aggregate.
As discussed in lecture, the TDP43 protein contains an intrinsically disordered region that is prone to aggregation. TDP43 aggregates have been observed in both familial and sporadic ALS patients. For this experiment, we will examine the effect of the small molecules on the formation of TDP43 aggregates using the protein purified in the previous laboratory sessions.
Protocols
Part 1: Participate in Communication Lab workshop
Our communication instructor, Dr. Prerna Bhargava, will join us today for a discussion on writing figure titles and captions.
Part 2: Concentrate TDP43-RRM12 protein elution
To prepare TDP43-RRM12 for the aggregation assay, it is important to concentrate the protein that was prepared in the previous laboratory session. Concentrating the protein eliminates excess buffer and contaminants. To do this, a centrifugal filter with a 3 kDa cutoff will be used. The cutoff value refers to the size of the molecules that are able to pass through the filter -- molecules smaller than 3 kDa flowthrough the filter whereas molecules larger than 3 kDa are retained in the reservoir above the filter. One critical consideration when selecting a centrifugal filter is the molecular weight of the protein of interest. The protein should be larger than the cutoff value to ensure it is retained in the reservoir above the filter.
For timing reasons, the Instructors concentrated the protein that you will use in your experiment. The steps for the concentration process are included below for your notes.
- Retrieve the desalted "elution" sample of the purified TDP43-RRM12 protein.
- Add the elution to the centrifugal filter unit.
- Remove the cap from the filter unit, then pipette the TDP43-RRM12 protein solution into the filter unit and replace the cap.
- Centrifuge at 4500 g for 20 minutes.
- Transfer the liquid from the top of the centrifugal filter unit to a fresh microcentrifuge tube.
- This is the concentrated TDP43-RRM12!

Part 3: Perform aggregation assay
Because limited TDP43-RRM12 protein was purified using the protocol on M1D3, each team will only test one of the small molecules they selected for this experiment. The Instructor will tell you which small molecule to use for the aggregation assay.
- Collect an aliquot of concentrated TDP43-RRM12 protein from the front laboratory bench.
- You will prepare four conditions for the aggregation assay: a buffer only condition to measure background, a TDP43-RRM12 with DMSO condition to test the protein in the vehicle used to prepare the small molecule, and TDP43-RRM12 with two concentrations of the small molecule.
- Use the notes below to calculate the volumes of DMSO and small molecule that will be added to each condition for the aggregation assay.
- You will add a volume of DMSO equivalent to the volume of small molecule added. The purpose of the DMSO is to account for any effects of the DMSO that was used to dissolve the small molecule solutions. In this, DMSO is the vehicle used and this condition serves as the negative control for your experiment.
- You will use the 1 mM stock concentration of the small molecule to prepare the TDP43-RRM12 + 3 μM condition. The final volume of the solution prepared for this condition will be 400 μL.
- You will use the 10 mM stock concentration of the small molecule to prepare the TDP43-RRM12 + 30 μM condition. The final volume of the solution prepared for this condition will be 400 μL.
- Confirm your calculations with the Instructor before preparing the conditions in the next step!
- Label four microcentrifuge tubes as follows:
- Buffer A
- TDP43-RRM12 + DMSO
- TDP43-RRM12 + 3 μM
- TDP43-RRM12 + 30 μM
- In the Buffer A tube, add 400 μL of Buffer A.
- In the TDP43-RRM12 + DMSO tube, add 400 μL of the concentrated TDP43-RRM12 aliquot and the volume of DMSO calculated in Step #3.
- In the TDP43-RRM12 + 3 μM tube, add 400 μL of the concentrated TDP43-RRM12 aliquot and the volume of 1 mM small molecule calculated in Step #3.
- In the TDP43-RRM12 + 30 μM tube, add 400 μL of the concentrated TDP43-RRM12 aliquot and the volume of 10 mM small molecule calculated in Step #3.
- To mix the samples, vortex each condition prepared above, then centrifuge for ~5 seconds to collect the liquid at the bottom of the tubes.
- Carefully carry your tubes to the front laboratory bench and load into the 96-well plate where indicated by the Instructor.
- Be sure to record the plate and well information for the location of your samples so you can retrieve your data at the end of the day!
- To load your samples into the 96-well plate, add 200 μL from each tube into two separate wells according to the plate map below.

- This will result in duplicate samples for each of the conditions.
- Be very careful not to lose any of your sample when pipetting as all of the liquid will be used for each condition!
- To read the aggregation of TDP43-RRM12, a plate reader will be used to measure the optical density at 405 nm.
- This is t = 0 for your experiment.
- After the t = 0 reading, cover the 96-well plate with parafilm and shake at 200 rpm at 37 °C for 1 hr.
- Again, take the plate to the plate reader and measure the optical density at 405 nm.
- This is t = 1 hr for your experiment.
- Recover the plate and shake at 200 rpm at 37 °C for 1 hr.
- Using the steps above, complete optical density measurements for t = 2 hr and t = 3 hr.
- To analyze your results, plot the data such that the optical density measurements are on the y-axis and time is on the x-axis.
- Post the raw data you collected and the plot you generated as an Excel spreadsheet to the Class data tab.
- Include the small molecule ID in the name of the document!

In your laboratory notebook, complete the following:
- Plot the results of the aggregation assay.
- What were the expected results for this experiment?
- What are the actual results for this experiment?
- Do you have confidence in the data acquired for this experiment? Why or why not?
- Review the data collected by your classmates for the small molecule you tested. Are your results consistent with those of your classmates?
- Review the data collected by your classmates for the small molecule that you did not test (the other small molecule you selected on M1D2). Are these results expected? Why or why not?
Part 4: Draft Data summary slide for protein purity and concentration results
To get a headstart and further feedback from the Instructors, you will draft the slide that will present the TDP43 protein purification data for your Data summary today in class. With your partner, use the template below, the Instructor comments from your previous homework assignments, and the helpful hints from the Comm Lab workshop to craft a data slide with the required elements.
Individually you and your laboratory partner each crafted figures (with a title and caption) using the TDP43 protein purification results. In this exercise you will come together to decide how to best present these data for the Data summary!

Reagents list
- centrifugal filter unit, 3 kDa cutoff (from Millipore)
Next day: Learn best practices for mammalian cell culture and seed CAD cells for TDP43-localization experiment