|
|
| Line 38: |
Line 38: |
| | | | |
| | '''Quantify fluorescence on 635 nm channel''' | | '''Quantify fluorescence on 635 nm channel''' |
| − | [[Image:Sp22 M1D2 P1 quantify 635nm.png|thumb|right|300px]] After the grid pattern is aligned, the fluorescence is measured on the 635 nm channel. In this, the slide is 'read' pixel by pixel and a numerical value is assigned that indicates the intensity of the signal measured at a particular pixel as illustrated in the image to the right. The computer software uses the numerical values to calculate the signal-to-noise ratio. | + | [[Image:Sp22 M1D2 P1 quantify 635nm.png|thumb|right|300px]] After the grid pattern is aligned, the fluorescence is measured on the 635 nm channel. In this, the slide is 'read' pixel by pixel and a numerical value is assigned that indicates the intensity of the signal measured at a particular pixel as illustrated in the image to the right. The computer software uses the numerical values to calculate the signal-to-noise ratio (<math> SNR </math>). |
| | + | |
| | + | <center> |
| | + | <math> SNR = \frac{\mu _{foreground}-\mu _{background}}{\theta_{background} |
| | + | </center> |
| | | | |
| | <font color = #4a9152 >'''In your laboratory notebook,'''</font color> complete the following: | | <font color = #4a9152 >'''In your laboratory notebook,'''</font color> complete the following: |
Revision as of 18:11, 18 January 2022
20.109(S22): Laboratory Fundamentals of Biological Engineering
Introduction
Though you may be able to qualitatively visualize the spots that appear to emit more fluorescence, it is important to complete quantitative analysis that supports your observations. The microarrayer reads the fluorescence signals emitted from the surface of the SMM slide at two excitation wavelengths. As noted previously, the 532 nm wavelength was used to excite fluorescein, which was printed in an 'X' pattern to assist with alignment. The 635 nm wavelength was used to excite Alexa Fluor 647; which would be associated with TDP43-RRM12 bound to a small molecule on the slide. A hit denotes a spot on the slide that emits a red fluorescence signal significantly higher than the background fluorescence level. In terms of protein binding, a hit denotes that the TDP43-RRM12 protein is bound to a small molecule and is therefore localized to a specific position on the slide. You will analyze the fluorescence signal collected by the microarray scanner using a value termed the robust z-score.
The robust z-score differentiates signal from noise by providing a value that represents the intensity of a signal above background. In the case of the SMM experiment, the intensity of a fluorescent signal above the background fluorescence is calculated. To do this the fluorescence emitted across the entire slide is grouped to define the Median Absolute Deviation (MAD), which is is a measure of the variability of a univariate dataset. Though beyond the scope of this class, the equation for calculating the robust z-score assigns a value for how much more intense the fluroescent signal at a spot is over background. The higher the value, the more different the signal from background.
When the SMM slides were imaged, the microarrayer also produced a GAL file, or GenePix Array List. The GAL file contains information about where each spot was printed, and what compound was printed there. However, the relationship between the GAL file and the actual contact of the print head is very imprecise. Instead, the fluorescein guide spots are used to align the array in the GAL file to the true print location for each pin. Following the alignment, the software quantifies the fluorescence at 635 nm within the deposition region of each spot (foreground) and the fluorescence immediately outside of this region, where nothing was printed (background) as illustrated in the image to the right. These values are used to calculate the robust z-score. From the robust z-score, you can determine the associated probability that the observed fluorescence occurred by chance, and if this probability is sufficiently low, we call the small molecule a 'hit'.
After hits are identified via the robust z-score, the data are examined by-eye using the criteria discussed in the prelab. In the exercises below you will review this process to gain a better understanding for how hits the hits identified in the SMM screen that targeted TDP43-RRM12 were validated.
Protocols
Part 1: Analyze SMM results
In the previous laboratory session, you reviewed how the SMM screen for TDP43-RRM12 was completed and how the slides were imaged for analysis. Prior to performing the SMM experiment, small molecule compounds were printed onto slides using the method described in the M1D1 Introduction. Each slide was printed with ~12,000 spots! In addition to ~4,200 small molecules (printed in duplicate), fluorescein and DMSO spots were included on every slide. The fluorescein spots, or sentinel spots, are used to align a grid pattern to the slide so the small molecule compounds at each spot can be identified. The DMSO spots are a negative control. Each slide is arranged as depicted below. The fluorescein spots are printed in an "X" pattern across the slide (panel A). Each "X" section represents a block within the slide (panel B).
The goal for today is to more thoroughly explore the analysis steps that were used to identify the hits for TDP43-RRM12. In this exercise you will consider the importance of each of the four steps listed below in the identification of hits.
- Align printed small molecule spots using fluorescence on 532 nm channel.
- Quantify fluorescence on 635 nm channel.
- Identify hits with improbably high fluorescence.
- Complete 'by-eye' analysis of hits.
Align printed small molecule spots using fluorescence on 532 channel
To process the slide images, a grid pattern (panel A) is aligned to each block using the fluorescence measured on the 532 channel. In the example to the right (panel B), the closed green spots represent the fluorescence signal on the 532 channel and the open green circles represent the software alignment. As you can see, the software misaligned the "X" pattern for this block. The orange arrows indicate the manual manipulation completed by the user to correct the alignment.
In your laboratory notebook, complete the following:
- What is the source of the fluorescence measured on the 532 nm channel?
- Why is it important that the "X" pattern is correctly aligned for each block?
Quantify fluorescence on 635 nm channel
After the grid pattern is aligned, the fluorescence is measured on the 635 nm channel. In this, the slide is 'read' pixel by pixel and a numerical value is assigned that indicates the intensity of the signal measured at a particular pixel as illustrated in the image to the right. The computer software uses the numerical values to calculate the signal-to-noise ratio (
$ SNR $).
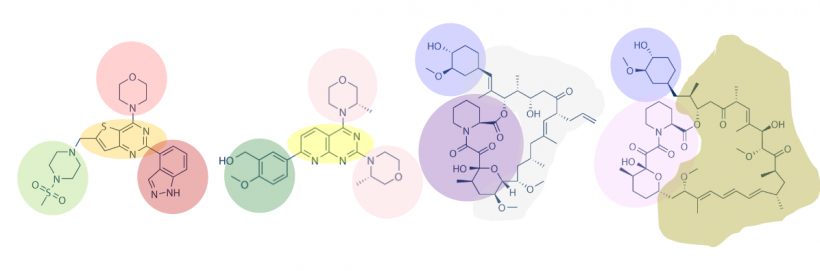
$ SNR = \frac{\mu _{foreground}-\mu _{background}}{\theta_{background} </center> <font color = #4a9152 >'''In your laboratory notebook,'''</font color> complete the following: *What is the source of the fluorescence measured on the 635 nm channel? *What does the presence of signal on the 635 nm channel indicate? '''Identify hits with improbably high fluorescence''' '''Complete 'by-eye' analysis of hits''' <font color = #4a9152 >'''In your laboratory notebook,'''</font color> complete the following: *Why is it important to complete a by-eye inspection of the SMM results? ===Part 2: Visually evaluate chemical structures of putative binders=== One method for assessing protein-small molecule binding is to visually inspect known small molecule binders for common features / structures. Your goal for today is to carefully examine the hits identified by the class and identify any common features / structures. As in the image below, it is possible that multiple features will be present within the same small molecule. [[Image:Sp17 20.109 M1D7 chemical structure features.png|thumb|750px|center|]] With your partner, review the hits that were identified in the SMM screen completed for PF3D7_20109-F21 (see table below). To see the chemical structures, translate the SMILES strings using one of the methods described in the text below the table. It may be easier to copy / paste the small molecule images into a powerpoint file so you can readily see all of the structures. Also, it may be helpful to use a color-coding system (like the one in the image provided above) to highlight features / structures that are common to the small molecules that putatively bind PF3D7_20109-F21. <center> {| border="1" |- | '''Compound ID''' | '''Compound #''' | '''SMILES''' |- | 43847864 | 3 | CN(CCOC)C[C@@H]1CN(C[C@@H]1CO)CC2=CC3=CC=CC=C3C=C2 |- | 30020341 | 2 | CN(CCO)C[C@@H]1CN(C[C@@H]1CO)CC2=CC3=CC=CC=C3C=C2 |- | 10351573 | 4 | C1CC1[C@H]2CN(C[C@@H]2N)C(=O)C3=CN=C(N=C3)NC4=CC=CC=C4 |- | 86998996 | 1 | CCNC1=NC=C(C=N1)C2=CC(=NC(=C2C#N)N)C3=CC=CN3 |- |} </center> '''These online resources may be helpful to learning more about the hits identified in the SMM:''' *Cloud version of ChemDraw [https://chemdrawdirect.perkinelmer.cloud/js/sample/index.html here]. **Copy and paste the small molecule smiles into the work space to get a chemical structure *Platform to transform the smiles information into a PubChem ID [https://pubchem.ncbi.nlm.nih.gov/idexchange/idexchange.cgi here]. **Copy and paste the smiles into the input ID search to determine the ID number. *PubChem database of chemical information [https://pubchem.ncbi.nlm.nih.gov here]. **Includes small molecule molecular weight and other useful information. <font color = #4a9152 >'''In your laboratory notebook,'''</font color> complete the following: *How many features did you identify that are present in two or more of the small molecules that putatively bind PF3D7_20109-F21? Are there more or less than you expected? *Is there a feature present in all of the identified small molecules? What might this suggest about the binding site(s) and / or binding ability of PF3D7_20109-F21? *Can you assign the identified small molecules to sub-groups based on the common features that are present? *What might the different features represent? More specifically, consider whether each subgroup has a unique binding site on the target protein or if each subgroup represents different solutions for interacting with the same binding site. *How might you make modifications to the small molecules / features to probe binding? As a hint, consider how different functional groups could be positioned at a given site without altering qualitative binding in the SMM assay to translate that into some testable ideas (e.g. quantitative binding properties may be occurring that are functionally relevant, but not discernible by SMM assays; or such a site is not critical for binding and may allow for modifications that confer beneficial properties of the compound). ===Part 3: Discuss journal article=== To further help you in preparing your Data summary, we will discuss how similar data are presented in a publication from the Koehler laboratory. Chen ''et al.'' titled "[[Media:SMMAlzABPeptide Koehler2010.pdf |Small molecule microarrays enable the discovery of compounds that bind the Alzheimer's Aβ peptide]]" (2010) ''J Am Chem Soc'' 132:17015-17022. The initial experiment presented by Chen ''et. al.'' was an SMM that identified ligands binders of the amyloid-β (Aβ) petptide. This first step is very similar to what was done to identify the hits you are testing in this module! To further assess the results of the SMM, the authors completed several follow-up experiments to test the effect of the small molecule on functionality of the Aβ petptide. In the context of your research, this article focuses on the next step experiments that can be performed after a drug candidate is discovered from a screen. Though you can use this article as guidance as you consider the experiments that could follow your screen, remember that the specific next step experiments should be related to the protein target and drug candidate(s) identified in your project. For this exercise, the focus in on how the data are organized and presented. '''From the Introduction''' Consider the key components of an introduction: *What is the big picture? *Is the importance of this research clear? *Are you provided with the information you need to understand the research? *Do the authors include a preview of the key results? '''From the Results''' Carefully examine the figures. First, read the captions and use the information to 'interpret' the data presented within the image. Second, read the text within the results section that describes the figure. *Do you agree with the conclusion(s) reached by the authors? *What controls were included and are they appropriate for the experiment performed? *Are you convinced that the data are accurate and/or representative? '''From the Discussion''' Consider the following components of a discussion: *Are the results summarized? *Did the authors 'tie' the data together into a cohesive and well-interpreted story? *Do the authors overreach when interpreting the data? *Are the data linked back to the big picture from the introduction? <font color = #4a9152 >'''In your laboratory notebook,'''</font color> complete the following: *Based on your reading and the group discussion of the article, answer the questions above. ==Navigation links== Next day: [[20.109(S22):M1D3 |Induce and purify TDP43 protein]] <br> Previous day: [[20.109(S22):M1D1 |Review small molecule microarray (SMM) technology]] <br> $


