Difference between revisions of "20.109(S20):Analyze titration curves (Day5)"
(→Introduction) |
(→Introduction) |
||
| Line 29: | Line 29: | ||
The figures below demonstrate how to read <math>K_d</math> from binding curves. You will find semilog plots (right) particularly useful today, but the linear plot (left) can be a helpful visualization as well. Keep in mind that every ''L'' value is associated with a particular equilbrium value of ''y'', while the curve as a whole gives information on the global equilibrium constant <math>K_d</math>. | The figures below demonstrate how to read <math>K_d</math> from binding curves. You will find semilog plots (right) particularly useful today, but the linear plot (left) can be a helpful visualization as well. Keep in mind that every ''L'' value is associated with a particular equilbrium value of ''y'', while the curve as a whole gives information on the global equilibrium constant <math>K_d</math>. | ||
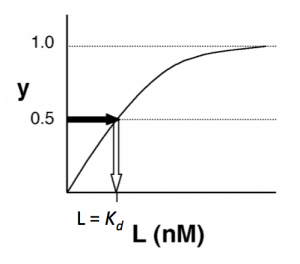
| − | [[ | + | [[Image:20109 Fa15 M2D7 figure.png|thumb|300px|left|'''Simple binding curve.''' The binding fraction ''y'' at first increases linearly as the starting ligand concentration is increased, then asymptotically approaches full saturation (''y''=1). The dissociation constant <math>K_d</math> is equal to the antigen concentration [''L''] for which ''y'' = 1/2.]] |
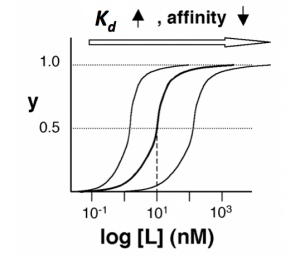
| − | [[ | + | [[Image:20109 Fa15 M2D7 figure2.png|thumb|300px|center|'''Semilog binding curves.''' By converting ligand concentrations to logspace, the dissociation constant is readily determined from the inflection point of the sigmoidal curve. The three curves each represent different antibody clones. The middle curve has a <math>K_d</math> close to 10 nM, while the right-hand curve has a higher <math>K_d</math> and therefore lower affinity between ligand and receptor (vice-versa for the left-hand curve).]] |
<br style="clear:both;"/> | <br style="clear:both;"/> | ||
Revision as of 20:48, 15 April 2020
Introduction
The antigen, lysozyme (L), and antibody (Ab) form a complex (C), which can be written
$ L + Ab \rightleftharpoons\ ^{k_f}_{k_r} C $
At equilibrium, the rates of the forward reaction (rate constant = $ k_f $) and reverse reaction (rate constant = $ k_r $) must be equivalent. Solving this equivalence yields an equilibrium dissociation constant $ K_d $, which may be defined either as $ k_r/k_f $, or as $ [Ab][L]/[C] $, where brackets indicate the molar concentration of a species. Meanwhile, the fraction of antibody that are bound to antigen at equilibrium, often called y or θ, is $ C/Ab_{TOT} $, where $ Ab_{TOT} $ indicates total (both bound and unbound) receptors. Note that the position of the equilibrium (i.e., y) depends on the starting concentrations of the reactants; however, $ K_d $ is always the same value. The total number of antibody $ Ab_{TOT} $= [C] (L-bound Ab) + [Ab] (unbound Ab). Thus,
$ \qquad y = {[C] \over Ab_{TOT}} \qquad = \qquad {[C] \over [C] + [Ab]} \qquad = \qquad {[L] \over [L] + [K_d]} \qquad $
where the right-hand equation was derived by algebraic substitution. If the antigen concentration is in excess of the concentration of the antibody, [L] may be approximated as a constant, L, for any given equilibrium. Let’s explore the implications of this result:
- What happens when L << $ K_d $?
- →Then y ~ $ L/K_d $, and the binding fraction increases in a first-order fashion, directly proportional to L.
- What happens when L >> $ K_d $?
- →In this case y ~1, so the binding fraction becomes approximately constant, and the antibodies are saturated.
- What happens when L = $ K_d $?
- →Then y = 0.5, and the fraction of antibodies that are bound to ligand is 50%. This is why you can read $ K_d $ directly off of the plots. When y = 0.5, the concentration of lysozyme (our [L]) is equal to $ K_d $. This is a great rule of thumb to know.
The figures below demonstrate how to read $ K_d $ from binding curves. You will find semilog plots (right) particularly useful today, but the linear plot (left) can be a helpful visualization as well. Keep in mind that every L value is associated with a particular equilbrium value of y, while the curve as a whole gives information on the global equilibrium constant $ K_d $.

Protocols
Reagents list
Next day: Research article presentation

