20.109(F22):M2D5

Contents
Introduction
Interactions between low molecular weight ligands, or small molecules, and proteins have been shown to increase the thermostability of proteins. This means that proteins bound to ligand are able to maintain tertiary structure, or resist denaturation, at higher temperatures than unbound proteins. Today we will use differential scanning fluorimetry (DSF) to examine the putative PfFKBP35 small molecule binders.
DSF is a method used to identify low molecular weight ligands that bind and stabilize a protein of interest. In this assay, protein denaturation is measured via a fluorescent dye that has an affinity for hydrophobic regions. When the protein is folded the hydrophobic pockets are inaccessible to the dye and the fluorescent signal is quenched by water in the solution. As the protein unfolds, the dye interacts with the hydrophobic regions and emits a fluorescent signal that can be detected.
When a protein is bound to a ligand, the stability can be increased such that the temperature at which the protein denatures is increased. In the DSF assay, this is measured as a shift in the Tm, or melting temperature; which is defined as the temperature at which 50% of the protein is unfolded. This value represents the midpoint of the transition from structured (folded) to denatured (unfolded).
The ΔTm is the difference between the Tm of the unbound protein sample, or protein sample without added ligand, and the bound protein sample, protein sample with added ligand. If the tested ligand binds the protein of interest, the ΔTm can be observed as a shift in the plotted DSF data. For example, the data below show results of a pilot experiment completed in preparation for this module. In this graph the Tm of FKBP12 (blue curve) is ~50 °C. With the addition of rapamycin (red curve) the Tm is shifted to ~78 °C resulting in a ΔTm of ~20 degrees.

Protocols
Part 1: Complete DSF experiment
The protein you purified in the previous laboratory session was pooled and prepared for use in the DSF assay. Specifically, the purified protein pool was diluted in 1X TBS to a final concentration of 0.25 mg/mL.
- Label 5 microcentrifuge tubes according to the table below:
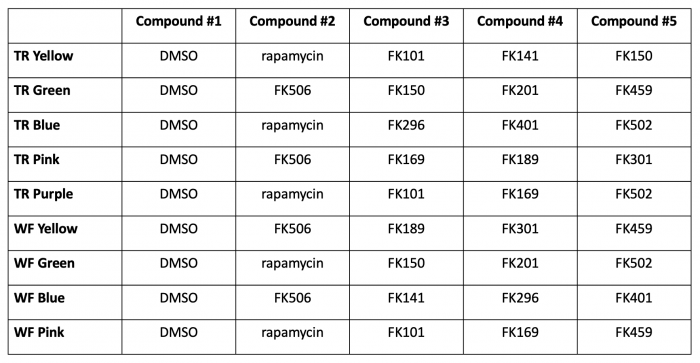

- Please note that in some cases you may be testing small molecules different than those selected in the previous laboratory section. To ensure that all small molecules were included and to ensure that replicates were completed for all small molecules, some changes were made to enhance the class data. Everyone will have access to all of the class data.
- Obtain an aliquot of the prepared PfFKBP35 protein from the front laboratory bench.
- Add 4 μL of Sypro Orange to the prepared PfFKBP35 protein and mix gently by pipetting.
- Transfer 70 μL of the prepared PfFKBP35 + Sypro Orange into each of the labeled microcentrifuge tubes prepared in Step #1.
- Add 7 μL of each of the small molecules to be tested into the appropriately labeled microcentrifuge tube.
- Small molecule solutions will be kept at the front laboratory bench. To add small molecule to your samples, take your protein aliquots to the front laboratory bench.
- Mix each tube gently by pipetting.
- Do not vortex samples!
- Prepare a second set of 5 microcentrifuge tubes using the prepared FKBP12 protein.
- Be sure to label tubes such that it is clear which set contains which protein!
- Transfer 20 μL aliquots from each tube into three wells of a 96-well plate according to the plate map below.
- Your Instructor will tell you which teams will share plates.
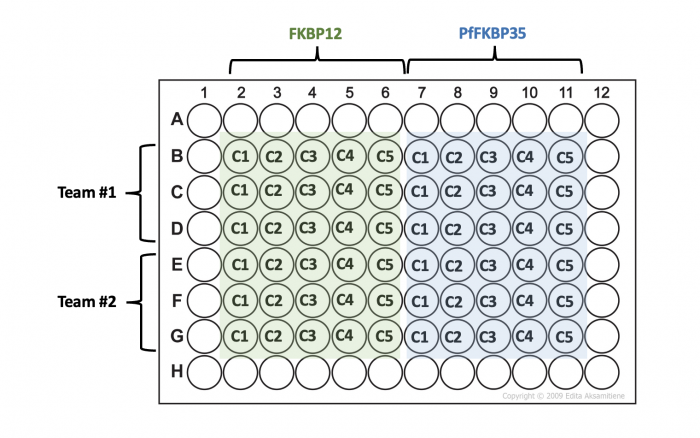
- Your Instructor will tell you which teams will share plates.
- Alert your Instructor when your plate is loaded as the samples will be measured in the BioMicro Center.


In your laboratory notebook, complete the following:
- Calculate the final concentration of protein used in the DSF experiment.
- Concentration of prepared protein = 0.25 mg/mL
- Calculate the final concentration of small molecule used in the DSF experiment.
- Concentration of small molecule stocks = 50 μM
- Why is DMSO included as one of the small molecules in the DSF experiment?
- Are you testing technical replicates or biological replicates in the DSF experiment?
Part 2: Prepare Journal article presentation
Use the downtime in class to get an early start on your Journal article presentation. Prepare your slides and script with the feedback from your homework and information provided during our Comm Lab workshop.
This is also a great time to get questions answered!
Reagents list
- PfFKBP35 (concentration = 0.25 mg/mL)
- FKBP12 (concentration = 0.25 mg/mL)
- Sypro Orange dye (from Thermo Fisher)
- small molecule compounds (50 μM) (from Chembridge)
- DMSO (from Sigma)
Next day: Complete data analysis of functional assay results